United Healthcare 2001 Annual Report Download - page 30
Download and view the complete annual report
Please find page 30 of the 2001 United Healthcare annual report below. You can navigate through the pages in the report by either clicking on the pages listed below, or by using the keyword search tool below to find specific information within the annual report.-
 1
1 -
2
-
3
-
4
-
5
-
6
-
7
-
8
-
9
-
10
-
11
-
12
-
13
-
14
-
15
-
16
-
17
-
18
-
19
-
 20
20 -
 21
21 -
 22
22 -
 23
23 -
 24
24 -
 25
25 -
 26
26 -
 27
27 -
 28
28 -
 29
29 -
 30
30 -
 31
31 -
 32
32 -
 33
33 -
 34
34 -
 35
35 -
 36
36 -
 37
37 -
 38
38 -
 39
39 -
 40
40 -
41
-
42
-
43
-
44
-
45
-
46
-
47
-
48
-
49
-
50
-
51
-
52
-
53
-
54
-
55
-
56
-
57
-
58
-
59
-
60
-
61
-
62
 |
 |

UnitedHealth Group
PAGE 29
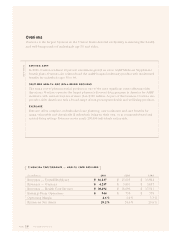
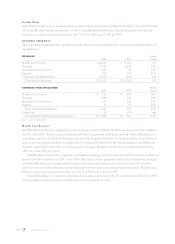
The following table summarizes individuals served by UnitedHealthcare, by major market segment
and funding arrangement, as of December 31 (in thousands):
2000 1999
Commercial
Insured (risk-based) 5,495 5,150
Fee-based 1,925 1,745
Total Commercial 7,420 6,895
1
Medicare 405 435
Medicaid 550 480
Total UnitedHealthcare 8,375 7,810
1Excludes individuals served through UnitedHealthcare platforms located in Puerto Rico and Pacific Coast regions. As of
December 31, 2000, UnitedHealthcare had substantially transitioned from these markets. Including these markets, commercial
individuals served at December 31, 1999, were 5,650 for insured products and 1,885 for fee-based products.
Uniprise
Uniprise had revenues of $2.1 billion in 2000, an increase of $275 million, or 15%, over 1999. This increase
was driven primarily by continued growth in Uniprise’s large multi-site customer base, which had an
11% increase in individuals served, as well as changes in funding arrangements selected by certain
customers and price increases on fee-based business. Uniprise served 6.7 million and 6.0 million individuals
as of December 31, 2000 and 1999, respectively. Uniprise’s earnings from operations grew by $67 million,
or 30%, over 1999 as a result of increased revenues. Operating margin improved to 13.5% in 2000 from
11.9% in 1999. Uniprise has expanded its operating margin by improving productivity through process
improvement initiatives, increased deployment of technology and further leveraging of fixed costs.
Specialized Care Services
Specialized Care Services’ revenues were $974 million in 2000, an increase of $248 million, or 34%, over
1999. This increase was driven primarily by an increase in the number of individuals served by United
Behavioral Health, and the acquisitions of Dental Benefit Providers, Inc. in June 1999 and National
Benefit Resources, Inc. in November 1999. Earnings from operations of $174 million increased by 36%
compared with 1999, in line with 2000 revenue growth. Specialized Care Services’ operating margin
improved from 17.6% in 1999 to 17.9% in 2000.
Ingenix
Ingenix had revenues of $375 million in 2000, an increase of $117 million, or 45%, over 1999. This
increase was driven by organic growth of $54 million and acquisitions made in 1999 that expanded the
company’s clinical research and development, clinical marketing and health information services.
Earnings from operations of $32 million increased 28% over 1999. Operating margin decreased to
8.5% in 2000 from 9.7% in 1999, principally as a result of increased goodwill amortization expense
associated with acquisitions.
Corporate
The decrease of $24 million in 2000 earnings reflects a decline in the level of unassigned cash and
investments and associated investment income, primarily due to share repurchases and incremental
process improvement costs in 2000.