United Healthcare 2001 Annual Report Download - page 28
Download and view the complete annual report
Please find page 28 of the 2001 United Healthcare annual report below. You can navigate through the pages in the report by either clicking on the pages listed below, or by using the keyword search tool below to find specific information within the annual report.-
 1
1 -
2
-
3
-
4
-
5
-
6
-
7
-
8
-
9
-
10
-
11
-
12
-
13
-
14
-
15
-
16
-
17
-
 18
18 -
 19
19 -
 20
20 -
 21
21 -
 22
22 -
 23
23 -
 24
24 -
 25
25 -
 26
26 -
 27
27 -
 28
28 -
 29
29 -
 30
30 -
 31
31 -
 32
32 -
 33
33 -
 34
34 -
 35
35 -
 36
36 -
 37
37 -
 38
38 -
39
-
40
-
41
-
42
-
43
-
44
-
45
-
46
-
47
-
48
-
49
-
50
-
51
-
52
-
53
-
54
-
55
-
56
-
57
-
58
-
59
-
60
-
61
-
62
 |
 |

UnitedHealth Group
PAGE 27
2 0 0 0 RESULTS COMPARED TO 1 9 99 RESULTS
CONSOLIDATED FINANCIAL RESULTS
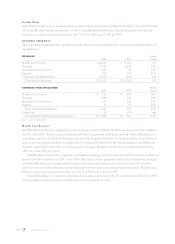
Revenues
Consolidated revenues increased in 2000 to $21.1 billion. Balanced growth across all business segments
was partially offset by targeted pullbacks and exits from certain geographic and Medicare markets.
Adjusted for the effects of these market transitions, consolidated revenues increased approximately
$2.2 billion, or 12%, over 1999. Following is a discussion of 2000 consolidated revenue trends for each
revenue component.
Premium Revenues Consolidated premium revenues in 2000 totaled $18.9 billion, an increase of
$1.4 billion, or 8%, compared with 1999. This increase was driven by two primary factors: premium
yield increases on UnitedHealthcare’s renewing commercial insured business and growth in the
number of individuals served. These increases were partially offset by withdrawals from certain
geographic and Medicare markets. Adjusted for the effect of these market withdrawals, premium
revenues increased 12% over 1999.
Fee Revenues Fee revenues in 2000 totaled $2.0 billion, an increase of $171 million, or 10%, over
1999. This increase resulted from record growth in Uniprise’s multi-site customer base, growth in
UnitedHealthcare’s fee-based business, modest price increases, and acquisitions and growth in the
Specialized Care Services and Ingenix businesses.
Investment and Other Income Investment and other income in 2000 totaled $232 million, an increase of
$13 million over 1999. Higher interest yields on investments in 2000 compared with 1999 were largely offset
by $34 million of net realized capital losses in 2000. Net realized capital losses were $6 million in 1999.
Medical Costs
The consolidated medical care ratio decreased from 85.7% in 1999 to 85.4% in 2000. Excluding AARP
business, on a year-over-year basis, the medical care ratio decreased 30 basis points to 83.9%. Year-over-
year medical care ratios decreased because commercial net premium yield increases exceeded the
increase in total benefit costs.
On an absolute dollar basis, medical costs increased $1.1 billion, or 7%, over 1999. The increase
was driven by growth in the number of individuals served with insured products, medical cost inflation,
increased consumption patterns, benefit changes and product mix changes.
Operating Costs
The operating cost ratio was 16.7% in 2000, compared with 17.1% in 1999. Using a revenue mix
comparable to 1999, the 2000 operating cost ratio would have decreased 80 basis points to 16.3%. This
decrease was primarily driven by productivity gains from process improvements, technology deployment
and cost management initiatives, and by further leveraging our fixed costs.
On an absolute dollar basis, operating costs increased by $177 million, or 5%, over 1999. This increase
reflects additional costs to support product and technology development initiatives and the 8% increase in
consolidated revenues in 2000, partially offset by productivity and technology improvements discussed above.
Depreciation and Amortization
Depreciation and amortization was $247 million in 2000 and $233 million in 1999. This increase
resulted primarily from higher levels of capital expenditures to support business growth and technology
enhancements, as well as amortization of goodwill and other intangible assets related to acquisitions.