Unilever 2012 Annual Report Download - page 9
Download and view the complete annual report
Please find page 9 of the 2012 Unilever annual report below. You can navigate through the pages in the report by either clicking on the pages listed below, or by using the keyword search tool below to find specific information within the annual report.-
 1
1 -
 2
2 -
 3
3 -
 4
4 -
 5
5 -
 6
6 -
 7
7 -
 8
8 -
 9
9 -
 10
10 -
 11
11 -
 12
12 -
 13
13 -
 14
14 -
 15
15 -
 16
16 -
 17
17 -
 18
18 -
 19
19 -
 20
20 -
21
-
22
-
23
-
24
-
25
-
26
-
27
-
28
-
29
-
30
-
31
-
32
-
33
-
34
-
35
-
36
-
37
-
38
-
39
-
40
-
41
-
42
-
43
-
44
-
45
-
46
-
47
-
48
-
49
-
50
-
51
-
52
-
53
-
54
-
55
-
56
-
57
-
58
-
59
-
60
-
61
-
62
-
63
-
64
-
65
-
66
-
67
-
68
-
69
-
70
-
71
-
72
-
73
-
74
-
75
-
76
-
77
-
78
-
79
-
80
-
81
-
82
-
83
-
84
-
85
-
86
-
87
-
88
-
89
-
90
-
91
-
92
-
93
-
94
-
95
-
96
-
97
-
98
-
99
-
100
-
101
-
102
-
103
-
104
-
105
-
106
-
107
-
108
-
109
-
110
-
111
-
112
-
113
-
114
-
115
-
116
-
117
-
118
-
119
-
120
-
121
-
122
-
123
-
124
-
125
-
126
-
127
-
128
-
129
-
130
-
131
-
132
-
133
-
134
-
135
-
136
-
137
-
138
-
139
-
140
-
141
-
142
-
143
-
144
-
145
-
146
-
147
-
148
-
149
-
150
-
151
-
152
-
153
 |
 |

6Unilever Annual Report and Accounts 2012Report of the Directors About Unilever
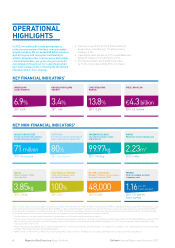
OPERATIONAL
HIHLIHTS
In 2012, we contnued to make good progress
n the transformaton of Unlever to a sustanable
growth company We exceeded 50 bllon turnover,
wth all regons and categores contrbutng to
growth Despte further cost ncreases and volatle
commodty markets, our gross margn rose by 01
percentage ponts and our core operatng margn
by 03 percentage ponts, reflectng the dscplned
mplementaton of our strategy
• Turnover is up 10.5% at €51.3 billion with net
acquisitions contributing 1.1% and currency
changes 2.2%
• Underlying sales growth of 6.9% is well balanced
between volume +3.4% and price +3.3%
• Emerging markets grew underlying sales
by 11.4%, now representing 55% of turnover
KEY FINANIAL INDIATORS*
UNDERLYIN
SALES ROWTH
6.9%
2011: 6.5%
UNDERLYIN VOLUME
ROWTH
3.4%
2011: 1.6%
ORE OPERATIN
MARIN
13.8%
2011: 13.5%
FREE ASH FLOW
€ 4.3 billion
2011: €3.1 billion
KEY NONFINANIAL INDIATORS†
HEALTH AND HYIENE
People reached with Lifebuoy
handwashing programmes
71 million
2011: 34.5 million
NUTRITION
Portfolio by volume meeting salt
levels equivalent to 5g per day
80%
◊
2011: See ◊ below
GREENHOUSE GASES
CO2 from energy per tonne
of production
99.97kg
2011: 118.31kg
WATER
Water per tonne of production
2.23m3
2011: 2.40m3
WASTE
Total waste per tonne
of production
3.85kg
2011: 4.96kg
SUSTAINABLE SOURCING
Palm oil purchases from
sustainable sources
100%
2011: 64%
BETTER LIVELIHOODS
Number of Shakti entrepreneurs
(cumulative since 2010)
48,000
2011: 45,000
PEOPLE
Total recordable accident
frequency rate
1.16 per 1m
hours worked
2011: 1.27 per 1m
hours worked
Basis of reporting: our accounting policies are in accordance with International Financial Reporting Standards (IFRS) as adopted by the European Union (EU) and as issued
by the International Accounting Standards Board (IASB), as well as United Kingdom and Dutch law. Certain measures used in our reporting are not defined under IFRS or
other generally accepted accounting principles. For further information about these measures, and the reasons why we believe they are important for an understanding
of the performance of the business, please refer to our commentary on non-GAAP measures on pages 34 and 35.
* Further details of our key financial indicators can be found in our Financial review starting on page 28.
† These key non-financial indicators form part of the Unilever Sustainable Living Plan. 2012 data is preliminary. Some of these KPIs will be independently assured in 2013.
See our Unilever Sustainable Living Plan: Progress Report 2012 and our online Unilever Sustainable Living Report for 2012 at www.unilever.com/sustainable-living,
to be published in April 2013.
◊
Measured January-September 2012. In 2012 we moved to full volume-based (tonnes sold) reporting for this target. This number is not comparable to previously reported
numbers measured by product (stock keeping unit).
†† NAMET refers to North Africa, Middle East and Turkey; AMET refers to Africa, Middle East and Turkey; and RUB refers to Russia, Ukraine and Belarus.