Unilever 2012 Annual Report Download - page 10
Download and view the complete annual report
Please find page 10 of the 2012 Unilever annual report below. You can navigate through the pages in the report by either clicking on the pages listed below, or by using the keyword search tool below to find specific information within the annual report.-
 1
1 -
 2
2 -
 3
3 -
 4
4 -
 5
5 -
 6
6 -
 7
7 -
 8
8 -
 9
9 -
 10
10 -
 11
11 -
 12
12 -
 13
13 -
 14
14 -
 15
15 -
 16
16 -
 17
17 -
 18
18 -
 19
19 -
 20
20 -
 21
21 -
22
-
23
-
24
-
25
-
26
-
27
-
28
-
29
-
30
-
31
-
32
-
33
-
34
-
35
-
36
-
37
-
38
-
39
-
40
-
41
-
42
-
43
-
44
-
45
-
46
-
47
-
48
-
49
-
50
-
51
-
52
-
53
-
54
-
55
-
56
-
57
-
58
-
59
-
60
-
61
-
62
-
63
-
64
-
65
-
66
-
67
-
68
-
69
-
70
-
71
-
72
-
73
-
74
-
75
-
76
-
77
-
78
-
79
-
80
-
81
-
82
-
83
-
84
-
85
-
86
-
87
-
88
-
89
-
90
-
91
-
92
-
93
-
94
-
95
-
96
-
97
-
98
-
99
-
100
-
101
-
102
-
103
-
104
-
105
-
106
-
107
-
108
-
109
-
110
-
111
-
112
-
113
-
114
-
115
-
116
-
117
-
118
-
119
-
120
-
121
-
122
-
123
-
124
-
125
-
126
-
127
-
128
-
129
-
130
-
131
-
132
-
133
-
134
-
135
-
136
-
137
-
138
-
139
-
140
-
141
-
142
-
143
-
144
-
145
-
146
-
147
-
148
-
149
-
150
-
151
-
152
-
153
 |
 |

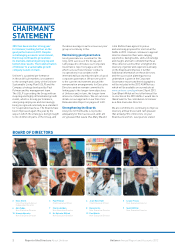
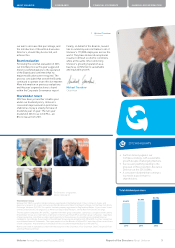
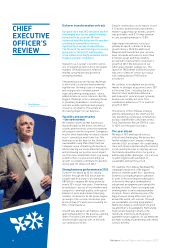
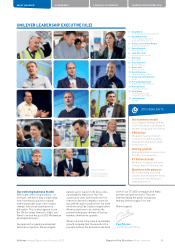
7Unilever Annual Report and Accounts 2012 Report of the Directors About Unilever
ABOUT UNILEVER GOVERNANCE FINANCIAL STATEMENTS SHAREHOLDER INFORMATION
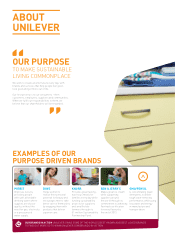
OUR ATEORIES
PERSONAL ARE
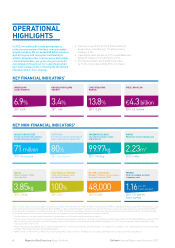
• Turnover €18.1 billion
• Underlying sales
growth 10.0%
• Underlying volume
growth 6.5%
• Market shares increased
across geographies, with
strong gains in Latin
America, NAMET & RUB††
and North America; driven
by haircare, deodorants
and skin cleansing
FOODS
• Turnover €14.4 billion
• Underlying sales
growth 1.8%
• Underlying volume
growth (0.9)%
• Market shares were down
slightly, reflecting a mixed
performance with volume
gains in dressings, offset
by declines in savoury and
volume share stabilisation
in spreads
REFRESHMENT
• Turnover €9.7 billion
• Underlying sales
growth 6.3%
• Underlying volume
growth 2.4%
• Market shares were
slightly down overall,
reflecting price aggressive
competition in ice cream
in developed markets
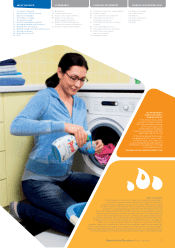
HOME ARE
• Turnover €9.1 billion
• Underlying sales
growth 10.3%
• Underlying volume
growth 6.2%
• Market share gains
were driven by powerful
performance in nearly all
our markets; in laundry
in particular in Europe,
China and South Africa
OUR EORAPHIAL AREAS
Asia/AMET/RUB††
• Turnover €20.4 billion
• Underlying sales growth 10.6%
• Underlying volume growth 5.7%
The Americas
• Turnover €17.1 billion
• Underlying sales growth 7.9%
• Underlying volume growth 3.1%
Europe
• Turnover €13.9 billion
• Underlying sales growth 0.8%
• Underlying volume growth 0.9%
FOR MORE: WWW.UNILEVER.COM/
INVESTORRELATIONS
On any given day
2 billion
consumers worldwide use
a Unilever product
Around
173,000
employees at the end of 2012
Turnover of
€5 1 billion
for 2012
Products sold in over
190
countries worldwide
7Report of the Directors About UnileverUnilever Annual Report and Accounts 2012