Toshiba 2013 Annual Report Download - page 9
Download and view the complete annual report
Please find page 9 of the 2013 Toshiba annual report below. You can navigate through the pages in the report by either clicking on the pages listed below, or by using the keyword search tool below to find specific information within the annual report.-
 1
1 -
 2
2 -
 3
3 -
 4
4 -
 5
5 -
 6
6 -
 7
7 -
 8
8 -
 9
9 -
 10
10 -
 11
11 -
 12
12 -
 13
13 -
 14
14 -
 15
15 -
 16
16 -
 17
17 -
 18
18 -
 19
19 -
 20
20 -
21
-
22
-
23
-
24
-
25
-
26
-
27
-
28
-
29
-
30
-
31
-
32
-
33
-
34
-
35
-
36
-
37
-
38
-
39
-
40
-
41
-
42
-
43
-
44
-
45
-
46
-
47
-
48
-
49
-
50
-
51
-
52
-
53
-
54
-
55
-
56
-
57
-
58
-
59
-
60
-
61
-
62
-
63
-
64
-
65
-
66
-
67
-
68
-
69
-
70
-
71
-
72
-
73
-
74
-
75
-
76
-
77
-
78
-
79
-
80
-
81
-
82
-
83
-
84
-
85
-
86
-
87
-
88
-
89
-
90
-
91
-
92
-
93
-
94
-
95
-
96
-
97
-
98
-
99
-
100
-
101
-
102
-
103
-
104
-
105
-
106
-
107
-
108
-
109
-
110
-
111
-
112
-
113
-
114
-
115
-
116
-
117
-
118
-
119
-
120
-
121
-
122
-
123
-
124
-
125
-
126
-
127
-
128
-
129
-
130
-
131
-
132
-
133
-
134
-
135
-
136
-
137
-
138
-
139
-
140
-
141
-
142
-
143
-
144
 |
 |

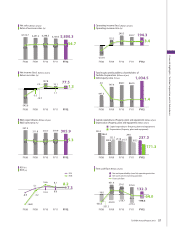
FY08 FY12FY11FY10FY09 FY08 FY12FY11FY10FY09
FY08 FY12FY11FY10FY09
FY08 FY12FY11FY10FY09
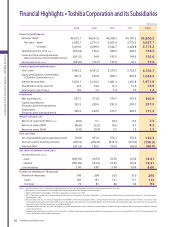
6,512.7 6,291.2 6,398.5 6,100.3 5,800.3 194.3
52.5 55.6 55.4
54.7 3.4
54.5
357.5
311.8 319.7 319.9 305.9
5.5 5.0 5.0
5.3
5.2
202.7
3.3
240.3
3.8
-233.4
2.0
125.2
-3.6
FY08 FY12FY11FY10FY09
FY08 FY12FY11FY10FY09
1,034.5
863.5
868.1
447.3
1.4
1.4
1.2
797.4
1.5
4.0
FY08 FY12FY11FY10FY09
171.3
237.3
203.3
299.1
215.7
231.0
306.9
355.5
252.5
209.4
132.3
-196.3
-64.0
335.0
-377.2
-42.2
374.1
159.4
198.5
-214.7
-252.9
-16.0
-351.3
451.4
-335.3
77.5
1.3
70.1
2.2
1.1
-0.3
-19.7
-343.6
137.8
-5.3
FY08 FY12FY11FY10FY09
8.2
7.3
16.6
10.4 8.6
8.1
5.1
-3.2
-8.9
-46.8
ROI
ROE
Net cash provided by (used in) operating activities
Net cash used in investing activities
Free cash flow
Capital expenditures (Property, plant and equipment)
Depreciation (Property, plant and equipment)
-
0
.
3
3
53
6
36
3.8
3
8
2
.
0
ROI (%)
ROE (%)
Capital expenditures (Property, plant and equipment) (Billions of yen)
Depreciation (Property, plant and equipment) (Billions of yen)
Net sales
(Billions of yen)
Ratio of overseas sales (%)
Total equity attributable to shareholders of
Toshiba Corporation
(Billions of yen)
Debt/equity ratio (Times)
Net income (loss) (Billions of yen)
Return on sales (%)
Free cash flow (Billions of yen)
R&D expenditures (Billions of yen)
R&D/sales ratio (%)
Operating income (loss) (Billions of yen)
Operating income ratio (%)
Financial Highlights • Toshiba Corporation and its Subsidiaries
07
TOSHIBA Annual Report 2013