Toshiba 2013 Annual Report Download - page 8
Download and view the complete annual report
Please find page 8 of the 2013 Toshiba annual report below. You can navigate through the pages in the report by either clicking on the pages listed below, or by using the keyword search tool below to find specific information within the annual report.-
 1
1 -
 2
2 -
 3
3 -
 4
4 -
 5
5 -
 6
6 -
 7
7 -
 8
8 -
 9
9 -
 10
10 -
 11
11 -
 12
12 -
 13
13 -
 14
14 -
 15
15 -
 16
16 -
 17
17 -
 18
18 -
 19
19 -
20
-
21
-
22
-
23
-
24
-
25
-
26
-
27
-
28
-
29
-
30
-
31
-
32
-
33
-
34
-
35
-
36
-
37
-
38
-
39
-
40
-
41
-
42
-
43
-
44
-
45
-
46
-
47
-
48
-
49
-
50
-
51
-
52
-
53
-
54
-
55
-
56
-
57
-
58
-
59
-
60
-
61
-
62
-
63
-
64
-
65
-
66
-
67
-
68
-
69
-
70
-
71
-
72
-
73
-
74
-
75
-
76
-
77
-
78
-
79
-
80
-
81
-
82
-
83
-
84
-
85
-
86
-
87
-
88
-
89
-
90
-
91
-
92
-
93
-
94
-
95
-
96
-
97
-
98
-
99
-
100
-
101
-
102
-
103
-
104
-
105
-
106
-
107
-
108
-
109
-
110
-
111
-
112
-
113
-
114
-
115
-
116
-
117
-
118
-
119
-
120
-
121
-
122
-
123
-
124
-
125
-
126
-
127
-
128
-
129
-
130
-
131
-
132
-
133
-
134
-
135
-
136
-
137
-
138
-
139
-
140
-
141
-
142
-
143
-
144
 |
 |

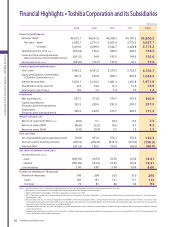
FY08 FY09 FY10 FY11 FY12
Financial performance
Net sales (Total) ¥6,512.7 ¥6,291.2 ¥6,398.5 ¥6,100.3 ¥5,800.3
Net sales—Japan 3,093.7 2,791.3 2,851.8 2,775.5 2,627.1
—Overseas 3,419.0 3,499.9 3,546.7 3,324.8
3,173.2
Operating income (loss)
(Note 1) (233.4) 125.2 240.3 202.7
194.3
Income (loss) from continuing operations,
before income taxes and noncontrolling interests
(261.5) 34.4 195.5 145.6 155.6
Net income (loss) (Note 2) (343.6) (19.7) 137.8 70.1
77.5
Financial position and indicators
Total assets 5,453.2 5,451.2 5,379.3 5,752.7 6,106.7
Equity attributable to shareholders
of Toshiba Corporation (Note 3) 447.3 797.4 868.1 863.5 1,034.5
Interest-bearing debt 1,810.7 1,218.3 1,081.3 1,235.8 1,471.6
Shareholders’ equity ratio (%) 8.2 14.6 16.1 15.0 16.9
Debt/equity ratio (Times)
4.0 1.5 1.2 1.4 1.4
Investment
R&D expenditures 357.5 311.8 319.7 319.9
305.9
Capital expenditures
(Property, plant and equipment) 355.5 209.4 231.0 299.1 237.3
Depreciation
(Property, plant and equipment) 306.9 252.5 215.7 203.3 171.3
Return indicators (%)
Return on investment (ROI) (Note 4) (8.9) 5.1 10.4 8.6 7.3
Return on equity (ROE) (46.8) (3.2) 16.6 8.1 8.2
Return on assets (ROA) (6.0) (0.4) 2.5 1.3 1.3
Free cash flow
Net cash provided by (used in) operating activities
(16.0) 451.4 374.1 335.0
132.3
Net cash used in investing activities (335.3) (252.9) (214.7) (377.2) (196.3)
Free cash flow (351.3) 198.5 159.4 (42.2)
(64.0)
Per share of common stock (yen)
Net income (loss) (Note 5)
—basic (106.18) (4.93) 32.55 16.54 18.31
—diluted (106.18) (4.93) 31.25 16.32 18.31
Cash dividends 5.00 0.00 5.00 8.00
8.00
Number of employees (Thousands)
Number of employees 199 204 203 210 206
Japan 126 123 121 117 113
Overseas 73 81 82 93 93
Notes: 1. Operating income (loss) is derived by deducting the cost of sales and selling, general and administrative expenses from net sales.
2. Net income (loss) attributable to shareholders of Toshiba Corporation is described as Net income (loss).
3. Equity attributable to shareholders of Toshiba Corporation is based on U.S. GAAP.
4. ROI = Operating income (loss)/(Average equity attributable to shareholders of Toshiba Corporation + Average equity attributable to noncontrolling interests + Average interest-
bearing debt) × 100
5. Basic earnings (losses) per share attributable to shareholders of Toshiba Corporation (EPS) is computed based on the weighted-average number of shares of common stock
outstanding during each period. Diluted EPS assumes the dilution that could occur if convertible bonds were converted or stock acquisition rights were exercised to issue common
stock, unless their inclusion would have an antidilutive e ect.
6. The Mobile Phone business has been classified as discontinued operations since FY2010. Prior-period data for FY2008 through FY2009 has been reclassified to conform with the
current classification.
7. Following the acquisition of Landis+Gyr AG in July 2011, Toshiba Corporation completed to allocate the acquisition cost to assets and liabilities in FY2012. Prior-period data for
FY2011 has been revised to re ect this change.
Financial Highlights
•
Toshiba Corporation and its Subsidiaries
(Billions of yen)
Financial Highlights • Toshiba Corporation and its Subsidiaries
06 TOSHIBA Annual Report 2013