Toshiba 2013 Annual Report Download - page 19
Download and view the complete annual report
Please find page 19 of the 2013 Toshiba annual report below. You can navigate through the pages in the report by either clicking on the pages listed below, or by using the keyword search tool below to find specific information within the annual report.-
 1
1 -
2
-
3
-
4
-
5
-
6
-
7
-
8
-
 9
9 -
 10
10 -
 11
11 -
 12
12 -
 13
13 -
 14
14 -
 15
15 -
 16
16 -
 17
17 -
 18
18 -
 19
19 -
 20
20 -
 21
21 -
 22
22 -
 23
23 -
 24
24 -
 25
25 -
 26
26 -
 27
27 -
 28
28 -
 29
29 -
30
-
31
-
32
-
33
-
34
-
35
-
36
-
37
-
38
-
39
-
40
-
41
-
42
-
43
-
44
-
45
-
46
-
47
-
48
-
49
-
50
-
51
-
52
-
53
-
54
-
55
-
56
-
57
-
58
-
59
-
60
-
61
-
62
-
63
-
64
-
65
-
66
-
67
-
68
-
69
-
70
-
71
-
72
-
73
-
74
-
75
-
76
-
77
-
78
-
79
-
80
-
81
-
82
-
83
-
84
-
85
-
86
-
87
-
88
-
89
-
90
-
91
-
92
-
93
-
94
-
95
-
96
-
97
-
98
-
99
-
100
-
101
-
102
-
103
-
104
-
105
-
106
-
107
-
108
-
109
-
110
-
111
-
112
-
113
-
114
-
115
-
116
-
117
-
118
-
119
-
120
-
121
-
122
-
123
-
124
-
125
-
126
-
127
-
128
-
129
-
130
-
131
-
132
-
133
-
134
-
135
-
136
-
137
-
138
-
139
-
140
-
141
-
142
-
143
-
144
 |
 |

FY12 FY13
Forecast FY15
Planned
Outside
Japan
55%
Japan
45%
BtoB
80%
BtoC
20%
BtoB
90%
10%
Outside
Japan
65%
Japan
35%
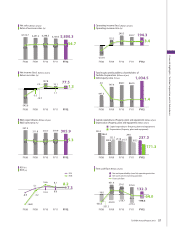
(Billions of yen)
5,800.3
193.4
3.3%
260.0
4.3%
400.0
5.7%
Net sales
Operating
Income
6,100.0
7,000.0
Achieving Growth
By value creation
Increasing Protability
By pursuing greater
productivity
Strengthening
Financial Base
By improving
cash ow management
Attaining further growth
7.1%
ROS*1
*1: Return on Sales *2: Compound Annual Growth Rate
CAGR*2
exceeding the
forecasts for the
world’s GDP
growth rate
FY13-15 FY2012 FY2013 FY2015FY13-15
D/E
Ratio*3
ROI*2
FCF*1
(Billions of yen)
*1: Free Cash Flow *2: Return On Investment = Operating income/(Shareholders’ Equity + Interest-bearing Debt) *3: Debt / Equity Ratio
7%
-64
9%
120
14%
120
Shareholders’
equity ratio
17%20%23%
1,090.0
1,440.0
x 1.42
x 1.01 x 0.80
R&D expenditures Capex, investment
& loans
Financial Base
BtoB
BtoC
BtoB
BtoC
Shareholders’
Equity
Interest-bearing
Debt
FY2012 55%FY2015 65%
Outside Japan sales
percentage FY2012 80%FY2015 90%
BtoB sales
percentage
Investment and Strong Financial Base
Realizing both strong pro t base and investment for Creative Growth
FY2015 Targets
Medium-term Business Plan
17
TOSHIBA Annual Report 2013