Telstra 2003 Annual Report Download - page 8
Download and view the complete annual report
Please find page 8 of the 2003 Telstra annual report below. You can navigate through the pages in the report by either clicking on the pages listed below, or by using the keyword search tool below to find specific information within the annual report.-
 1
1 -
 2
2 -
 3
3 -
 4
4 -
 5
5 -
 6
6 -
 7
7 -
 8
8 -
 9
9 -
 10
10 -
 11
11 -
 12
12 -
 13
13 -
 14
14 -
 15
15 -
 16
16 -
 17
17 -
 18
18 -
 19
19 -
20
-
21
-
22
-
23
-
24
-
25
-
26
-
27
-
28
-
29
-
30
-
31
-
32
-
33
-
34
-
35
-
36
-
37
-
38
-
39
-
40
-
41
-
42
-
43
-
44
-
45
-
46
-
47
-
48
-
49
-
50
-
51
-
52
-
53
-
54
-
55
-
56
-
57
-
58
-
59
-
60
-
61
-
62
-
63
-
64
 |
 |

P.6
are introduced, competitors adopt distinctive strategies, and capital markets demand a return
to fiscal discipline.
Telstra management remains alert to the impact of these trends on the Company. We continue
to maximise the value of our existing businesses. Our cost control efforts are more rigorous and
focused than ever. We have a methodical approach to developing new business, in particular,
internet, data and wireless, and allocating capital.
Financial performance
We are pleased to advise that this year we have produced a better result than that
foreshadowed in the half-year report.
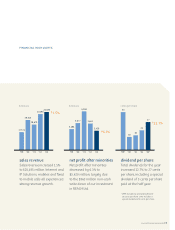
The financial health of the Company is very sound. Sales revenue grew only moderately
compared with the previous corresponding period, reflecting the low growth environment and
market share erosion in some segments. Adjusting to this environment we managed down
capital expenditure and accelerated cost reductions. Both are contributing to record levels of
free cash flow. Our balance sheet remains very strong.
Profit after tax and minorities was $3.4 billion – a decrease of 6.3% over the previous
corresponding period, due largely to the non-cash write down of REACH, our Asian infrastructure
joint venture company. Looking at the result on an underlying basis, which strips out one-off
items and allows a like-for-like comparison between this fiscal year and last year, Telstra’s net
profit after tax and minorities grew 6.4%.
The good news on the dividend front continues. Your directors have declared a final ordinary
dividend of 12 cents per share, 100% franked. Together with the interim and special dividend
paid earlier in the year, this takes total dividends for the year to 27 cents – with total dividends
declared to our 1.8 million shareholders of $3.5 billion, up 22.7% on last year.
Capital management
Telstra’s strong free cash flow generation has provided the Company’s directors with the opportunity
to return capital, which is surplus to our operational requirements, to shareholders in the form of an
off-market share buyback. The buyback, to be in the range $800-$1,000 million, will increase earnings
per share and consequently is expected to have a positive effect on the Company’s share price.
We will be writing to all shareholders in the near future to provide further information.
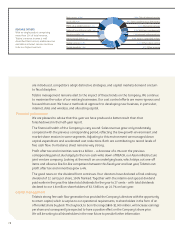
13.0% Data & internet services
5.6% Sensis (advertising & directories )
5.4% Intercarrier services
2.3% Solutions management
2.3% Inbound calling products
8.5% Various controlled entities
National long distance calls 5.4%
PSTN value added services 1.3%
Local calls 7.2%
Basic access 14.3%
Fixed to mobile 7.0%
International direct 1.4%
4.4% Other sales & service
5.2% Other revenue
Mobile services 14.9%
Mobile handsets 1.8%
REVENUE DRIVERS
With no single product comprising
more than 15% of total revenue,
Telstra’s revenue income is well
diversified. Basic access, mobile services
and data & internet services continue
to be our highest earners.