Telstra 2003 Annual Report Download - page 13
Download and view the complete annual report
Please find page 13 of the 2003 Telstra annual report below. You can navigate through the pages in the report by either clicking on the pages listed below, or by using the keyword search tool below to find specific information within the annual report.-
 1
1 -
2
-
 3
3 -
 4
4 -
 5
5 -
 6
6 -
 7
7 -
 8
8 -
 9
9 -
 10
10 -
 11
11 -
 12
12 -
 13
13 -
 14
14 -
 15
15 -
 16
16 -
 17
17 -
 18
18 -
 19
19 -
 20
20 -
 21
21 -
 22
22 -
 23
23 -
24
-
25
-
26
-
27
-
28
-
29
-
30
-
31
-
32
-
33
-
34
-
35
-
36
-
37
-
38
-
39
-
40
-
41
-
42
-
43
-
44
-
45
-
46
-
47
-
48
-
49
-
50
-
51
-
52
-
53
-
54
-
55
-
56
-
57
-
58
-
59
-
60
-
61
-
62
-
63
-
64
 |
 |

www.telstra.com.au/investor P.11
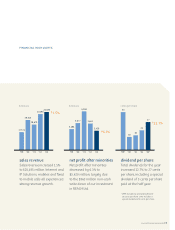
Many customers.
Telstra’s diverse revenue stream
is shifting from traditional to
non-traditional products.
–Total sales revenue for 2003 was
$20.5b,compared with $16.7b in 1998
–Fixed line products made up 50%
of sales revenue in 1998. They now
account for 39%
–Mobile goods and services
contribute 18% to total sales
revenue, compared to 13% in 1998
–Revenue from controlled entities
is now 9% of sales revenue, but
was negligible in 1998
Increasingly, customers want the
convenience of a single bill and the
advantages of bundled solutions.
Through bundling, customers can
save on their home, mobile, internet
and subscription TV services. Telstra
now has over 1.2 million customers
in bundled solutions.
–Total packaged customers across
consumer and small business
segments has increased 23% since
July 2002
–Customers on packages are far
more likely to stay with Telstra
–FOXTEL is performing strongly with
over 150,000 customers on our
“FOXTEL from Telstra” offering
Growth in consumer packages
at 30 June 2003
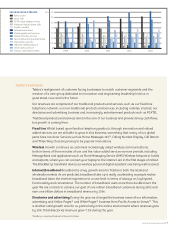
Telstra is a fully integrated service
provider with leading market shares
across a broad range of products
and services.
Telstra’s market share
Telstra 76%
Other 8%
Resold 16%
Telstra 66%
Other 34%
Telstra 53%
Other 47%
Telstra 46%
Other 54%
Local calls
Domestic
long distance
minutes
International
long distance
minutes
Mobile services
Basic access
services
Telstra 63%
Other 37%
Te ls tra
(FOXTEL) 57%
Other 43%
Telstra 13%
Other 87%
Data revenue
(excluding ISDN)
Subscription
TV services
Sensis advertising
revenue
(main media)
Telstra Other Resold
Telstra 27%
Other 73%
Telstra 78%
Other 8%
Resold 14%
Internet services –
narrowband
Telstra 50%
Other 32%
Resold 18%
Internet services –
broadband
Source: Telstra estimates
Telstra’s market share Bundled services Changing revenue streams
Fixed line 50%
Mobile 13%
Data, text
& internet 13%
Directory services 6%
Customer premises
equipment 3%
Intercarrier services 3%
Other sales &
service 12%
1998 Sales Revenue Mix
2003 Sales Revenue Mix
Fixed line 39%
Mobile 18%
Data, text
& internet 14%
Directory services 6%
Customer premises
equipment 1%
Intercarrier services 6%
Other sales &
service 7%
Controlled entities 9%
Jan ’01
Jul ’01
Jan ’02
Jul ’02
Jan ’03
Jun ’03
0
0.5m
1.0m
1.5m
2.0m
Consumer packages
Single Bill