Telstra 2003 Annual Report Download - page 7
Download and view the complete annual report
Please find page 7 of the 2003 Telstra annual report below. You can navigate through the pages in the report by either clicking on the pages listed below, or by using the keyword search tool below to find specific information within the annual report.-
 1
1 -
 2
2 -
 3
3 -
 4
4 -
 5
5 -
 6
6 -
 7
7 -
 8
8 -
 9
9 -
 10
10 -
 11
11 -
 12
12 -
 13
13 -
 14
14 -
 15
15 -
 16
16 -
 17
17 -
 18
18 -
19
-
20
-
21
-
22
-
23
-
24
-
25
-
26
-
27
-
28
-
29
-
30
-
31
-
32
-
33
-
34
-
35
-
36
-
37
-
38
-
39
-
40
-
41
-
42
-
43
-
44
-
45
-
46
-
47
-
48
-
49
-
50
-
51
-
52
-
53
-
54
-
55
-
56
-
57
-
58
-
59
-
60
-
61
-
62
-
63
-
64
 |
 |

www.telstra.com.au/investor P.5
For the Company, being a full service, fully integrated provider with leading positions in fixed line
services, mobiles, data and internet gives us diversity in our income stream. Not only does this
help to ensure we maintain consistency of earnings, it enables us to generate solid and reliable
cash flow in our traditional businesses such as our fixed line network – the businesses on which
this Company has been built.At the same time,it facilitates cross-selling – bundling – of products
and services in ways that customers value.
It’s all about outcomes – for our millions of customers, an enhanced experience when they
do business with Telstra; for the Company, margin protection and an improved bottom line.
Achieving both outcomes is fundamentally important to shareholder value.
Industry overview
In our view, this past year brought to an end the correction period following the dotcom
expansionary phase. Of course, market structures will continue to change as new technologies
Our vision
Telstra – Australia’s connection to the future
Our mission
To develop, design and deliver great
communications solutions to every customer
Our strategic goal
Profitable growth
Our values
•Service
•Respect for the Individual
•Integrity
•Commitment and Accountability
•Trust
•Leadership and Teamwork
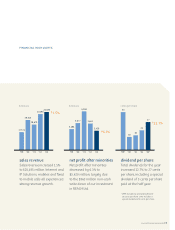
2003 2002 Change
Financial Highlights $m $m %
Sales revenue 20,495 20,196 1.5
Total revenue (excluding interest revenue) 21,616 20,802 3.9
Total expenses* 12,446 11,319 10.0
Profit before income tax expense 4,928 5,446 (9.5)
Income tax expense 1,534 1,796 (14.6)
Net profit after minorities 3,429 3,661 (6.3)
Free cash flow 4,565 3,840 18.9
Earnings per share 26.6¢ 28.5¢ (6.7)
Total dividends per share 27.0¢ 22.0¢ 22.7
Return on average assets 16.3% 17.5% (1.2)
Full time staff and equivalents** 42,064 44,977 (6.5)
* Includes equity accounted losses, but before depreciation, amortisation and borrowing costs
** Includes all domestic and offshore employees, including controlled entities