Sunoco 2013 Annual Report Download - page 10
Download and view the complete annual report
Please find page 10 of the 2013 Sunoco annual report below. You can navigate through the pages in the report by either clicking on the pages listed below, or by using the keyword search tool below to find specific information within the annual report.-
 1
1 -
 2
2 -
 3
3 -
 4
4 -
 5
5 -
 6
6 -
 7
7 -
 8
8 -
 9
9 -
 10
10 -
 11
11 -
 12
12 -
 13
13 -
 14
14 -
 15
15 -
 16
16 -
 17
17 -
 18
18 -
 19
19 -
 20
20 -
 21
21 -
 22
22 -
 23
23 -
 24
24 -
 25
25 -
 26
26 -
 27
27 -
 28
28 -
 29
29 -
 30
30 -
 31
31 -
 32
32 -
 33
33 -
 34
34 -
 35
35 -
 36
36 -
 37
37 -
 38
38 -
 39
39 -
 40
40 -
 41
41 -
 42
42 -
 43
43 -
 44
44 -
 45
45 -
 46
46 -
 47
47 -
 48
48 -
 49
49 -
 50
50 -
 51
51 -
 52
52 -
 53
53 -
 54
54 -
 55
55 -
 56
56 -
 57
57 -
 58
58 -
 59
59 -
 60
60 -
 61
61 -
 62
62 -
 63
63 -
 64
64 -
 65
65 -
 66
66 -
 67
67 -
 68
68 -
 69
69 -
 70
70 -
 71
71 -
 72
72 -
 73
73 -
 74
74 -
 75
75 -
 76
76 -
 77
77 -
 78
78 -
 79
79 -
 80
80 -
 81
81 -
 82
82 -
 83
83 -
 84
84 -
 85
85 -
 86
86 -
 87
87 -
 88
88 -
 89
89 -
 90
90 -
 91
91 -
 92
92 -
 93
93 -
 94
94 -
 95
95 -
 96
96 -
 97
97 -
 98
98 -
 99
99 -
 100
100 -
 101
101 -
 102
102 -
 103
103 -
 104
104 -
 105
105 -
 106
106 -
 107
107 -
 108
108 -
 109
109 -
 110
110 -
 111
111 -
 112
112 -
 113
113 -
 114
114 -
 115
115 -
 116
116 -
 117
117 -
 118
118 -
 119
119 -
 120
120 -
 121
121 -
 122
122 -
 123
123 -
 124
124 -
 125
125 -
 126
126 -
 127
127 -
 128
128 -
 129
129 -
 130
130 -
 131
131 -
 132
132 -
 133
133 -
 134
134 -
 135
135 -
 136
136 -
 137
137 -
 138
138 -
 139
139 -
 140
140 -
 141
141 -
 142
142 -
 143
143 -
 144
144 -
 145
145 -
 146
146 -
 147
147 -
 148
148 -
 149
149 -
 150
150 -
 151
151 -
 152
152 -
 153
153 -
 154
154 -
 155
155 -
 156
156 -
 157
157 -
 158
158 -
 159
159 -
 160
160 -
 161
161 -
 162
162 -
 163
163 -
 164
164 -
 165
165 -
 166
166 -
 167
167 -
 168
168 -
 169
169 -
 170
170 -
 171
171 -
 172
172 -
 173
173 -
 174
174 -
 175
175 -
 176
176 -
 177
177 -
 178
178 -
 179
179 -
 180
180 -
 181
181 -
 182
182 -
 183
183 -
 184
184 -
 185
185 -
 186
186 -
 187
187 -
 188
188 -
 189
189 -
 190
190 -
 191
191 -
 192
192 -
 193
193 -
 194
194 -
 195
195 -
 196
196 -
 197
197 -
 198
198 -
 199
199 -
 200
200 -
 201
201 -
 202
202 -
 203
203 -
 204
204 -
 205
205 -
 206
206 -
 207
207 -
 208
208 -
 209
209 -
 210
210 -
 211
211 -
 212
212 -
 213
213 -
 214
214 -
 215
215 -
 216
216 -
 217
217 -
 218
218 -
 219
219 -
 220
220 -
 221
221 -
 222
222 -
 223
223 -
 224
224 -
 225
225 -
 226
226 -
 227
227 -
 228
228 -
 229
229 -
 230
230 -
 231
231 -
 232
232 -
 233
233 -
 234
234 -
 235
235 -
 236
236 -
 237
237 -
 238
238 -
 239
239 -
 240
240 -
 241
241 -
 242
242 -
 243
243 -
 244
244 -
 245
245 -
 246
246 -
 247
247 -
 248
248 -
 249
249 -
 250
250 -
 251
251 -
 252
252 -
 253
253 -
 254
254 -
 255
255 -
 256
256 -
 257
257 -
 258
258 -
 259
259 -
 260
260 -
 261
261 -
 262
262 -
 263
263 -
 264
264 -
 265
265 -
 266
266 -
 267
267 -
 268
268 -
 269
269 -
 270
270 -
 271
271 -
 272
272 -
 273
273 -
 274
274 -
 275
275 -
 276
276 -
 277
277 -
 278
278 -
 279
279 -
 280
280 -
 281
281 -
 282
282 -
 283
283 -
 284
284 -
 285
285 -
 286
286 -
 287
287 -
 288
288 -
 289
289 -
 290
290 -
 291
291 -
 292
292 -
 293
293 -
 294
294 -
 295
295 -
 296
296 -
 297
297 -
 298
298 -
 299
299 -
 300
300 -
 301
301 -
 302
302 -
 303
303 -
 304
304 -
 305
305 -
 306
306 -
 307
307 -
 308
308 -
 309
309 -
 310
310 -
 311
311 -
 312
312 -
 313
313 -
 314
314 -
 315
315 -
 316
316
 |
 |

8
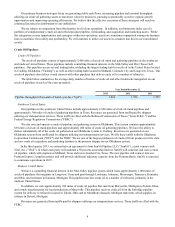
The following table outlines the number of active terminals and storage capacity by state:
State Number of
Terminals Storage
Capacity
(thousands
of barrels)
Indiana 1 206
Louisiana 1 161
Maryland 1 710
Massachusetts 1 1,144
Michigan 3 760
New Jersey 3 650
New York (1) 4 920
Ohio 7 957
Pennsylvania 13 1,743
Texas 4 548
Virginia 1 403
Total 39 8,202
(1) We have a 45 percent ownership interest in a terminal at Inwood, New York and a 50 percent ownership interest in a
terminal that we operate in Syracuse, New York. The storage capacities included in the table represent the
proportionate share of capacity attributable to our ownership interests in these terminals.
Refined Products Acquisition and Marketing
Our refined products acquisition and marketing activities include the acquisition, blending, marketing and selling of
refined products and NGLs at our various terminals and third-party facilities. Since the acquisition of our butane blending
business in 2010, we have continued to expand our butane blending service platform by installing our blending technology at
certain of our refined product terminals, as well as at third-party facilities. We have also commenced operations in the NGL
market with the acquisition of the Marcus Hook Facility (see below). The operating results of our refined products acquisition
and marketing activities are dependent on our ability to execute sales in excess of the aggregate cost, and therefore we structure
our acquisition and marketing operations to optimize the sources and timing of purchases and minimize the transportation and
storage costs. In order to manage exposure to volatility in refined products prices, our policy is to (i) only purchase refined
products for which sales contracts have been executed or for which ready markets exist, (ii) structure sales contracts so that
price fluctuations do not materially impact the margins earned, and (iii) not acquire and hold physical inventory, futures
contracts or other derivative instruments for the purpose of speculating on commodity price changes. However, we do utilize a
seasonal hedge program involving swaps, futures and other derivative instruments to mitigate the risk associated with
unfavorable market movements in the price of refined products and NGLs. These derivative contracts act as a hedging
mechanism against the volatility of prices.
Nederland Terminal
The Nederland Terminal, which is located on the Sabine-Neches waterway between Beaumont and Port Arthur, Texas, is
a large marine terminal providing storage and distribution services for refiners and other large transporters of crude oil. The
terminal receives, stores, and distributes crude oil, feedstocks, lubricants, petrochemicals, and bunker oils (used for fueling
ships and other marine vessels), and also blends lubricants. The terminal currently has a total storage capacity of approximately
22 million barrels in approximately 130 aboveground storage tanks with individual capacities of up to 660 thousand barrels.
The Nederland Terminal can receive crude oil at each of its five ship docks and three barge berths. The five ship docks
are capable of receiving over 2 million bpd of crude oil. In addition to our Crude Oil Pipelines, the terminal can also receive
crude oil through a number of other pipelines, including:
• the Cameron Highway pipeline, which is jointly owned by Enterprise Products and Genesis Energy;
• the ExxonMobil Pegasus pipeline;
• the Department of Energy ("DOE") Big Hill pipeline; and
• the DOE West Hackberry pipeline.
The DOE pipelines connect the terminal to the United States Strategic Petroleum Reserve's West Hackberry caverns at
Hackberry, Louisiana and Big Hill near Winnie, Texas, which have an aggregate storage capacity of approximately 400 million
barrels.
