Sunbeam 2014 Annual Report Download - page 16
Download and view the complete annual report
Please find page 16 of the 2014 Sunbeam annual report below. You can navigate through the pages in the report by either clicking on the pages listed below, or by using the keyword search tool below to find specific information within the annual report.-
 1
1 -
2
-
3
-
4
-
5
-
 6
6 -
 7
7 -
 8
8 -
 9
9 -
 10
10 -
 11
11 -
 12
12 -
 13
13 -
 14
14 -
 15
15 -
 16
16 -
 17
17 -
 18
18 -
 19
19 -
 20
20 -
 21
21 -
 22
22 -
 23
23 -
 24
24 -
 25
25 -
 26
26 -
27
-
28
-
29
-
30
-
31
-
32
-
33
-
34
-
35
-
36
-
37
-
38
-
39
-
40
-
41
-
42
-
43
-
44
-
45
-
46
-
47
-
48
-
49
-
50
-
51
-
52
-
53
-
54
-
55
-
56
-
57
-
58
-
59
-
60
-
61
-
62
-
63
-
64
-
65
-
66
-
67
-
68
-
69
-
70
-
71
-
72
-
73
-
74
-
75
-
76
-
77
-
78
-
79
-
80
-
81
-
82
-
83
-
84
 |
 |

14 Jarden Corporation Annual Report 2014
Selected Quarterly Financial Data (Unaudited)
(In millions, except per share amounts)
First
Quarter
Second
Quarter
Third
Quarter
Fourth
Quarter(b) Total
2014
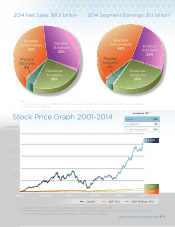
Net sales $ 1,731.8$1,975.1 $2,142.2 $2,438.0 $8,287.1
Gross prot 514.4 602.0 673.3 843.2 2,632.9
Net income as reported 3.7 52.1 108.6 78.1 242.5
Basic earnings per share (a) 0.02 0.28 0.59 0.42 1.31
Diluted earnings (loss) per share (a) 0.02 0.28 0.58 0.41 1.28
2013
Net sales $ 1,580.7$1,758.8 $1,800.8$2,215.6 $7,355.9
Gross prot 443.5 513.5 523.2 634.5 2,114.7
Net income (loss) as reported (4.4)76.4 94.9 37.0 203.9
Basic earnings (loss) per share (a) (0.03)0.47 0.57 0.20 1.20
Diluted earnings (loss) per share (a) (0.03)0.47 0.56 0.19 1.18
Selected Financial Data
Jarden Corporation Annual Report 2014
The results of Rexair Holdings, Inc., Yankee Candle Investments LLC, Mapa Spontex Baby Care and Home Care businesses, Aero
Products International, Inc. and Quickie Manufacturing Corporation are included from their dates of acquisition of August29,
2014,October3, 2013,April1, 2010,October1, 2010 and December17, 2010, respectively.
Restructuring costs include costs associated with exit or disposal activities, including costs of employee and lease terminations
and facility closings or other exit activities (see Note16 to the consolidated nancial statements).
In January 2012, the Company announced that the Company’s Board of Directors (the “Board”) had decided to suspend the
Company’s dividend program following the dividend paid on January31, 2012.
Working capital is dened as current assets less current liabilities. For 2014, 2013, 2012, 2011 and 2010, working capital excluding
cash was $1.1 billion, $916 million, $1.0 billion, $1.2 billion and $998 million, respectively.
(b)
(c)
(d)
(e)
Earnings per share calculations for each quarter are based on the weighted average number of shares outstanding for each
period, and the sum of the quarterly amounts may not necessarily equal the annual earnings per share amounts.
The results of operations for the fourth quarter of 2014 include $151 of foreign exchange-related charges related to the Company’s
Venezuela operations (see Note 1 to the consolidated nancial statements), non-cash impairment charges of $25.4 related to
the impairment intangible assets (see Note 6 to the consolidated nancial statements) and a gain of $38.7 on the sale of an
Asian manufacturing facility. The results of operations for the fourth quarter of 2013 includes a charge of $78.9 for the purchase
accounting adjustment for the elimination of manufacturer’s prot in inventory related to the YCC Acquisition, a gain of
approximately $28 on the sale of certain assets and $38.8 of stock-based compensation related to a grant of common stock to
certain executive ofcers (see Note 13 to the consolidated nancial statements).
(a)
(b)
• 2010 includes: $70.6 million of non-cash charges related to the Company’s Venezuela operations (see Note 1 to the consolidated
nancial statements); $42.3 million of acquisition-related and other charges, net, primarily related to 2010 acquisitions; purchase
accounting adjustments of $27.4 million for the purchase accounting adjustment charged to cost of sales for the elimination of
manufacturer’s prot in inventory related to acquisitions; and a $19.7 million non-cash charge related to the impairment of goodwill
and intangibles.