Sunbeam 2014 Annual Report Download - page 14
Download and view the complete annual report
Please find page 14 of the 2014 Sunbeam annual report below. You can navigate through the pages in the report by either clicking on the pages listed below, or by using the keyword search tool below to find specific information within the annual report.-
 1
1 -
2
-
3
-
 4
4 -
 5
5 -
 6
6 -
 7
7 -
 8
8 -
 9
9 -
 10
10 -
 11
11 -
 12
12 -
 13
13 -
 14
14 -
 15
15 -
 16
16 -
 17
17 -
 18
18 -
 19
19 -
 20
20 -
 21
21 -
 22
22 -
 23
23 -
 24
24 -
25
-
26
-
27
-
28
-
29
-
30
-
31
-
32
-
33
-
34
-
35
-
36
-
37
-
38
-
39
-
40
-
41
-
42
-
43
-
44
-
45
-
46
-
47
-
48
-
49
-
50
-
51
-
52
-
53
-
54
-
55
-
56
-
57
-
58
-
59
-
60
-
61
-
62
-
63
-
64
-
65
-
66
-
67
-
68
-
69
-
70
-
71
-
72
-
73
-
74
-
75
-
76
-
77
-
78
-
79
-
80
-
81
-
82
-
83
-
84
 |
 |

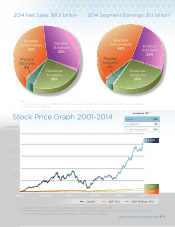
Historical Performance
12 Jarden Corporation Annual Report 2014
Note: For a reconciliation of Segment Earnings to GAAP Operating Earnings please see pages 79-80.
1. Non-GAAP – excluding restructuring, non-operational and non-cash charges and credits.
2. For full year 2014, cash flow from operations of $627 million is inclusive of a $42 million cash charge primarily representing
the cost of interest acceleration related to the early repayment of Jarden’s 2020 bonds.
CAGR 30%
CAGR 25%
CAGR 20%
Net Sales
Cash Flow from Operations
$3,846
$7,356
$6,696$6,680
$6,023
$5,153
$5,383
$4,660
$3,189
$839
$588
$368
$8,287
$236
$669
$627 (2)
$480
$427
$289
$641
$250
$305
$241
$74
$71
Adjusted EBITDA
(Segment Earnings)(1)
$419
$936
$814
$791
$710
$606
$609
$502
$298
$115
$87
$75
$1,104
2003
2003
2003
2004
2004
2004
2005
2005
2005
2006
2006
2006
2007
2007
2007
2008
2008
2008
2009
2009
2009
2010
2010
2010
2011
2011
2011
2012
2012
2012
2013
2013
2013
2014
2014
2014
2002
2002
2002
$70
(in Millions)