Stein Mart 2008 Annual Report Download - page 18
Download and view the complete annual report
Please find page 18 of the 2008 Stein Mart annual report below. You can navigate through the pages in the report by either clicking on the pages listed below, or by using the keyword search tool below to find specific information within the annual report.-
 1
1 -
2
-
3
-
4
-
5
-
6
-
7
-
 8
8 -
 9
9 -
 10
10 -
 11
11 -
 12
12 -
 13
13 -
 14
14 -
 15
15 -
 16
16 -
 17
17 -
 18
18 -
 19
19 -
 20
20 -
 21
21 -
 22
22 -
 23
23 -
 24
24 -
 25
25 -
 26
26 -
 27
27 -
 28
28 -
29
-
30
-
31
-
32
-
33
-
34
-
35
-
36
-
37
-
38
-
39
-
40
-
41
-
42
-
43
-
44
-
45
-
46
-
47
-
48
 |
 |
Liquidity and Capital Resources
The Company's primary source of liquidity is the sale of its merchandise inventories. Capital requirements and working capital needs
are funded through a combination of internally generated funds, a revolving credit facility and credit terms from vendors. Working
capital is needed to support store inventories and capital investments for new store openings and to maintain existing stores.
Historically, the Company's working capital needs are lowest in the first quarter and highest in either the third or fourth quarter in
anticipation of the fourth quarter peak selling season. As of January 31, 2009, the Company had $88.9 million in cash and cash
equivalents.
Net cash provided by operating activities was $19.4 million in 2008, $17.8 million in 2007 and $30.3 million in 2006. Despite the
increased net loss, cash provided by operating activities increased $1.5 million over 2007. The increase was primarily due to $26.9
million less cash used for inventories, a $16.9 million decrease in cash used for income taxes receivable/payable and $8.4 million
more cash provided by other operating activities, offset by $35.4 million less cash provided by net loss plus non-cash charges and
$15.3 million more cash used to reduce accounts payable. Less cash was needed for income taxes in 2008 due to a significant
income tax receivable recorded at February 2, 2008. Inventories decreased in 2008 compared to 2007 due to lower sales resulting in
less inventory being purchased and lower inventory levels.
Operating cash flows for 2007 decreased $12.5 million from 2006 due to a $37.1 million decrease in cash provided by net income
(loss) plus non-cash charges, a $24.8 million increase in cash used for income taxes receivable/payable and a $4.2 million increase in
cash used for other working capital accounts excluding inventory. Inventories decreased $28.4 million in 2007 and increased $25.2
million in 2006. Inventories decreased in 2007 compared to 2006 due to lower sales resulting in less inventory being purchased and
lower inventory levels.
Net cash (used in) provided by investing activities was $(19.3) million in 2008, $(15.1) million in 2007 and $45.3 million in 2006. The
net liquidation of short-term investments provided $10.8 million and $94.1 million of cash in 2007 and 2006, respectively. Capital
expenditures were higher in 2006 due primarily to remodeling costs for existing stores and the roll-out of new point-of-sale equipment
and software. Capital expenditures were lower in 2008 compared to 2007 primarily due to fewer new stores opened.
Net cash provided by (used in) financing activities was $73.7 million in 2008, $(5.2) million in 2007 and $(78.3) million in 2006. More
cash was provided by financing activities during 2008 primarily due to higher net borrowings, no cash dividends paid and fewer shares
of common stock repurchased. In February 2008, the Board of Directors suspended the payment of a quarterly dividend in order to
conserve cash until improvements occur in the Company’s business and in the current difficult economic conditions. Dividends paid
were higher in 2006 compared to 2007 due to a special dividend of $1.50 per share totaling $65.4 million.
The Company expects to invest approximately $8-9 million in capital expenditures in 2009. The cost of opening a new store in 2008
ranged from $650,000 to $750,000 for fixtures, equipment, leasehold improvements and pre-opening costs (primarily advertising,
stocking and training). Pre-opening costs are expensed at the time of opening. Initial inventory investment for a new store is
approximately $925,000.
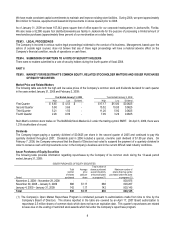
The Company has a $150 million senior revolving secured credit agreement (the “Agreement”) with a group of lenders which extends
through January 2011. Borrowings are based on and collateralized primarily by eligible inventory. During the third quarter of 2008,
the Company borrowed an additional $75 million under the Agreement to increase its cash position while building seasonal
inventories and approaching peak borrowing needs and in light of uncertainties in the credit markets at that time. At January 31,
2009, the Company had $100 million in direct borrowings, $8 million of outstanding standby letters of credit and $69.5 million invested
in short-term U.S. Treasury money market funds. Subsequent to year end, the Company liquidated these money market funds and
repaid that portion of its borrowings. Approximately $42 million was available under the Agreement at January 31, 2009 and the
Company is in compliance with the terms of the Agreement.
Although our cash provided by operating activities may be negatively affected by general economic conditions, we believe that we will
continue to generate positive cash flow from operations, which, along with our available cash and borrowing capacity under the
revolving credit agreement, will provide the means needed to fund our operations for the foreseeable future. While we have available
borrowing capacity under our revolving credit agreement, tightening of the credit markets could make it more difficult for us to enter
into agreements for new indebtedness or obtain funding through public or private equity or debt financing. The effects of these
changes could also require us to make additional changes to our current plans and strategies.
16