Stein Mart 2008 Annual Report Download - page 12
Download and view the complete annual report
Please find page 12 of the 2008 Stein Mart annual report below. You can navigate through the pages in the report by either clicking on the pages listed below, or by using the keyword search tool below to find specific information within the annual report.-
 1
1 -
 2
2 -
 3
3 -
 4
4 -
 5
5 -
 6
6 -
 7
7 -
 8
8 -
 9
9 -
 10
10 -
 11
11 -
 12
12 -
 13
13 -
 14
14 -
 15
15 -
 16
16 -
 17
17 -
 18
18 -
 19
19 -
 20
20 -
 21
21 -
 22
22 -
23
-
24
-
25
-
26
-
27
-
28
-
29
-
30
-
31
-
32
-
33
-
34
-
35
-
36
-
37
-
38
-
39
-
40
-
41
-
42
-
43
-
44
-
45
-
46
-
47
-
48
 |
 |

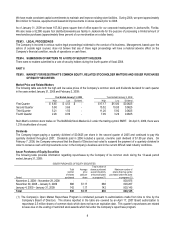
Performance Graph
The following graph compares the cumulative total stockholder return on the Company’s common stock with the cumulative total
return to the NASDAQ Composite Index and the Dow Jones US Apparel Retailers Index for the last five years ended January 31,
2009. The comparison assumes $100 was invested at the beginning of the five year period in Stein Mart, Inc. stock and in each of
the indices shown and assumes reinvestment of any dividends.
$0
$20
$40
$60
$80
$100
$120
$140
$160
$180
$200
1/31/2004 1/29/2005 1/28/2006 2/3/2007 2/2/2008 1/31/2009
Dollars
Stein Mart, Inc. NASDAQ Composite Dow Jones US Apparel Retailers
1/31/2004 1/29/2005 1/28/2006 2/3/2007 2/2/2008 1/31/2009
Stein Mart, Inc. $100.0 $181.2 $161.6 $144.5 $64.2 $12.8
NASDAQ Composite 100.0 101.0 114.6 125.0 120.4 73.2
Dow Jones US Apparel Retailers 100.0 123.4 139.8 164.2 129.6 69.4
10