Stein Mart 2008 Annual Report Download - page 16
Download and view the complete annual report
Please find page 16 of the 2008 Stein Mart annual report below. You can navigate through the pages in the report by either clicking on the pages listed below, or by using the keyword search tool below to find specific information within the annual report.
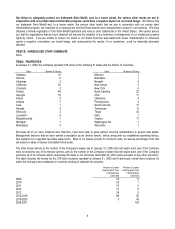
closed in 2007; and the 2006 table presents the sum of the losses from the ten stores closed during 2008, the two stores closed in
2007 and the six stores closed in 2006.
2008 2007 2006
Sales $22,729 $38,883 $53,925
Cost of merchandise sold 20,419 32,202 42,415
Gross profit 2,310 6,681 11,510
Selling, general and administrative expenses 11,902 13,426 17,201
Other income, net 259 407 575
Loss from operations $ (9,333) $ (6,338) $ (5,116)
# of stores closed in 2006-2008 10 12 18
Operating losses from closed stores include the following store closing and asset impairment charges (in thousands):
2008 2007 2006
Lease termination costs $3,568 $ 889 $1,325
Asset impairment charges 688 850 151
Severance 1,129 256 452
Total $5,385 $1,995 $1,928
Year Ended January 31, 2009 Compared to Year Ended February 2, 2008
Net sales for the year ended January 31, 2009 were $1,326.5 million, down 9.0% from $1,457.6 million for the prior year. The $131.2
million decrease reflects a $152.2 million decrease in the comparable store group and a $16.2 million decrease in the closed store
group, offset by a $37.2 million increase in the non-comparable store group due to the inclusion of sales for the 14 stores opened in
2007 and the six stores opened in 2008. The closed store group includes the ten stores closed in 2008 and the two stores closed in
2007. Comparable stores sales for 2008 decreased 10.9% compared to 2007.
Gross profit for year ended January 31, 2009 was $294.2 million or 22.2 percent of net sales compared to $361.4 million or 24.8
percent of net sales for the prior year. The $67.2 million decrease in gross profit reflects a $64.9 million decrease in the comparable
store group and a $4.4 million decrease in the closed store group, partially offset by a $2.1 million increase in the non-comparable
store group due to the inclusion of operating results for the 14 stores opened in 2007 and the six stores opened in 2008. Gross profit
as a percent of sales decreased during fiscal 2008 due to a 1.1 percentage point increase in markdowns and a 2.0 percentage point
increase in buying and occupancy costs, offset by a 0.5 percentage point increase in markup.
SG&A expenses were $394.8 million or 29.8 percent of net sales for the year ended January 31, 2009 as compared to $388.6 million
or 26.7 percent of net sales for 2007. SG&A expenses for 2008 include $25.4 million of primarily non-cash pre-tax asset impairment
and store closing charges compared to $5.2 million in 2007. Asset impairment charges were $16.7 million higher than last year due to
a greater number of stores with projected cash flows that do not support the carrying value of their long-lived assets. Store closing
charges increased $3.5 million over last year because ten stores were closed in 2008 compared to only two store closings in 2007.
Excluding asset impairment and store closing charges, SG&A expenses were $369.3 million or 27.8 percent of sales in 2008
compared to $383.4 million or 26.3 percent of sales in 2007. This $14.1 million decrease in SG&A expenses resulted primarily from
significant reductions in advertising and store operating expenses, somewhat offset by professional fees related to expense reduction
initiatives. Advertising expenses decreased $15.2 million this year due primarily to reduced broadcast media. Store operating
expenses decreased $8.2 million for the comparable store group due to cost saving initiatives and decreased $3.4 million for the
closed store group, but were offset by an $8.9 million increase for the non-comparable store group due to the inclusion of operating
results for the 14 stores opened in 2007 and the six stores opened in 2008. Corporate SG&A expenses were higher in 2008 primarily
due to professional fees related to ongoing expense reduction initiatives and higher benefit costs, while last year included $1.8 million
of separation costs for the resignation of the former President/Chief Executive Officer. SG&A expenses as a percentage of net sales
were higher this year due to a lack of leverage on lower sales.
Pre-opening expenses for the six stores opened in 2008 and the 14 stores opened in 2007 amounted to $1.5 million and $2.7 million,
respectively.
Other income, net decreased $1.0 million in 2008 compared to 2007 due to decreases in credit card income and shoe department
income, both resulting from the decreased net sales.
14


