Stein Mart 2008 Annual Report Download - page 13
Download and view the complete annual report
Please find page 13 of the 2008 Stein Mart annual report below. You can navigate through the pages in the report by either clicking on the pages listed below, or by using the keyword search tool below to find specific information within the annual report.-
 1
1 -
2
-
 3
3 -
 4
4 -
 5
5 -
 6
6 -
 7
7 -
 8
8 -
 9
9 -
 10
10 -
 11
11 -
 12
12 -
 13
13 -
 14
14 -
 15
15 -
 16
16 -
 17
17 -
 18
18 -
 19
19 -
 20
20 -
 21
21 -
 22
22 -
 23
23 -
24
-
25
-
26
-
27
-
28
-
29
-
30
-
31
-
32
-
33
-
34
-
35
-
36
-
37
-
38
-
39
-
40
-
41
-
42
-
43
-
44
-
45
-
46
-
47
-
48
 |
 |

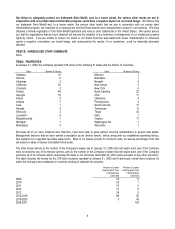
ITEM 6. SELECTED CONSOLIDATED FINANCIAL DATA (Dollars in Thousands, Except Per Share and Per Square Foot Data)
The following selected consolidated financial data has been derived from our audited consolidated financial statements and should
be read in conjunction with “Management’s Discussion and Analysis of Financial Condition and Results of Operations” and the
Company’s Consolidated Financial Statements and notes thereto and the other information contained elsewhere in this Form 10-K.
Consolidated Statement of Operations Data: 2008 2007 2006(1) 2005 2004
Net sales $1,326,469 $1,457,645 $1,501,296 $1,481,615 $1,459,607
Cost of merchandise sold 1,032,232 1,096,235 1,084,975 1,065,409 1,070,803
Gross profit 294,237 361,410 416,321 416,206 388,804
Selling, general and administrative expenses (2) 394,767 388,572 376,611 353,104 341,932
Other income, net 20,401 21,376 18,214 15,477 14,277
Income (loss) from operations (80,129) (5,786) 57,924 78,579 61,149
Interest (expense) income, net (1,753) (794) 1,006 2,026 332
Income (loss) from continuing operations before income
taxes (81,882) (6,580) 58,930 80,605 61,481
Income tax benefit (provision) 10,581 2,050 (21,754) (29,721) (23,363)
Income (loss) from continuing operations (71,301) (4,530) 37,176 50,884 38,118
Loss from discontinued operations, net of tax benefit -- - - (145)
Net income (loss) $ (71,301) $ (4,530) $ 37,176 $ 50,884 $ 37,973
Basic income
(
loss
)p
er share:
Continuing operations $(1.72) $(0.11) $0.86 $1.18 $0.90
Discontinued operations -----
Total $(1.72) $(0.11) $0.86 $1.18 $0.90
Diluted income (loss) per share:
Continuing operations $(1.72) $(0.11) $0.85 $1.15 $0.89
Discontinued operations -----
Total $(1.72) $(0.11) $0.85 $1.15 $0.89
Cash dividends paid per share $ - $ 0.25 $1.75 $0.1875 $ -
Adjusted Non-GAAP Measures: (3)
Adjusted income (loss) per diluted share $(0.87) $(0.04) $0.89 $1.20 $0.96
Consolidated Operating Data:
Stores open at end of period 276 280 268 262 261
Sales per store including shoe department (4) $5,113 $5,737 $6,079 $6,123 $6,058
Sales per store excluding shoe department (5) $4,778 $5,363 $5,644 $5,687 $5,642
Sales per square foot including shoe department (4) $170 $190 $201 $202 $199
Sales per square foot excluding shoe department (5) $171 $192 $201 $202 $200
Comparable store net sales (decrease) increase (6) (10.9)% (4.0)% (1.2)% 0.2% 9.1%
Consolidated Balance Sheet Data:
Working capital $206,104 $165,469 $174,785 $237,079 $211,242
Total assets 449,890 460,539 480,351 519,845 480,108
Long-term debt 100,000 27,133 - - -
Total stockholders’ equity 186,350 256,689 288,172 323,739 276,510
(1) 2006 is a 53-week year; all others are 52-week years.
(2) Selling, general and administrative expenses include asset impairment and store closing charges of $25.4 million in 2008, $5.2 million in 2007, $2.6 million in
2006, $3.5 million in 2005 and $4.9 million in 2004.
(3) SEC Regulation G - The Company reports its consolidated financial results in accordance with generally accepted accounting principles (GAAP). However, to
supplement these consolidated financial results, management believes that certain non-GAAP operating results, which exclude asset impairment and store closing
charges and the valuation allowance for deferred tax assets, may provide a more meaningful measure on which to compare the Company's results of operations
between periods. The Company believes these non-GAAP results provide useful information to both management and investors by excluding certain charges that
impact the comparability of the results.
11