Southwest Airlines 1999 Annual Report Download - page 12
Download and view the complete annual report
Please find page 12 of the 1999 Southwest Airlines annual report below. You can navigate through the pages in the report by either clicking on the pages listed below, or by using the keyword search tool below to find specific information within the annual report.-
 1
1 -
 2
2 -
 3
3 -
 4
4 -
 5
5 -
 6
6 -
 7
7 -
 8
8 -
 9
9 -
 10
10 -
 11
11 -
 12
12 -
 13
13 -
 14
14 -
 15
15 -
 16
16 -
 17
17 -
 18
18 -
 19
19 -
 20
20 -
 21
21 -
 22
22 -
23
-
24
-
25
-
26
-
27
-
28
-
29
-
30
-
31
-
32
-
33
-
34
-
35
-
36
-
37
-
38
-
39
-
40
-
41
-
42
-
43
-
44
-
45
-
46
-
47
-
48
-
49
-
50
-
51
-
52
-
53
-
54
 |
 |

There are many cities we do not serve that offer tremendous growth opportunities.
As the specialist in low-fare, point-to-point service, we are unique in the U.S. And over 100
cities have petitioned us for service because they understand the favorable economic
impact the “Southwest Effect” would have on their communities. After we enter a market
with lots of flights and fares that are as much as two-thirds lower than fares before our entry,
passenger traffic explodes, often three- or four-fold. We’ve demonstrated that our
expansion is profitable, particularly considering the last five years’ results. So we’re
anxious to continue growing.
Over the last several years, we have added service to Florida and New England. In
1999, we expanded into Islip, New York, and Hartford, Connecticut. The East Coast is a
relatively new region for Southwest and is anchored by Baltimore with 95 daily flights.
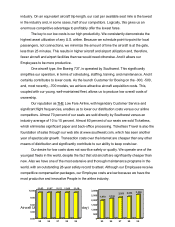
Currently, the East represents approximately 22 percent of our route system. As the chart
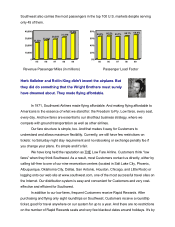
below shows, we plan to continue growing our 737 fleet. And with only 55 cities and eight
percent of the domestic market, we have opportunities to significantly expand our route
system in both new and existing cities. We will add Albany, New York, in May 2000 and at
least one other city later in the year.
As a result of our low-fare, high-frequency, point-to-point strategy, we’re the largest
carrier at many of the cities we serve. Our low-fare philosophy generates substantial
demand which allows us to offer lots of convenient flights. For example, our top ten cities’
daily departures are currently: Phoenix, 177; Houston Hobby, 149; Las Vegas, 149; Dallas
Love Field, 139; Los Angeles International, 122; Chicago Midway, 118; Oakland, 112;
Baltimore, 95; St. Louis, 88; and San Diego, 78. This is very different from our hub-and-
spoke competitors, which have large concentrations of flights at a couple of “hub” cities.
Our Heartland region (Texas and surrounding states) constitutes about 15 percent of our
capacity, while our Western region is our largest, at 47 percent. The Midwest region rounds
out our system at 16 percent.
Jet Fleet (at December 31, 1999)
737 Type Seats Average
Age (Yrs.)
Number of
Aircraft
-200 122 17.9 35
-300 137 8.5 195
-500 122 8.7 25
-700 137 0.9 57
Total 8.2 312