Southwest Airlines 1995 Annual Report Download - page 7
Download and view the complete annual report
Please find page 7 of the 1995 Southwest Airlines annual report below. You can navigate through the pages in the report by either clicking on the pages listed below, or by using the keyword search tool below to find specific information within the annual report.-
 1
1 -
 2
2 -
 3
3 -
 4
4 -
 5
5 -
 6
6 -
 7
7 -
 8
8 -
 9
9 -
 10
10 -
 11
11 -
 12
12 -
 13
13 -
 14
14 -
 15
15 -
 16
16 -
 17
17 -
 18
18 -
19
-
20
-
21
-
22
-
23
-
24
-
25
-
26
-
27
-
28
-
29
-
30
-
31
-
32
-
33
-
34
-
35
-
36
-
37
-
38
-
39
-
40
-
41
-
42
-
43
-
44
-
45
-
46
 |
 |

7
Field, Houston Hobby, and Las Vegas McCarran with 168, 137, 136, and 128
daily flights, respectively. At the airports we serve, we consistently have among
the largest number of Customers boarded of all airlines. We ranked first or
second in terms of Customers boarded in the majority of our 46 airports served
in 1995.
As a result of the combination of low fares, high frequencies, convenience, and
outstanding Customer Service, we dominate the majority of the shorthaul
markets we serve. We consistently rank first in market share in approximately 80
to 90 percent of our top 100 city-pair markets, and, in the aggregate, 60 to 70
percent of the total market share. Southwest also carries the most passengers in
the top 100 U.S. markets despite serving only 41 of them.
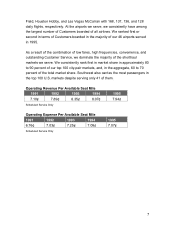
Operating Revenue Per Available Seat Mile
1991 1992 1993 1994 1995
7.10¢ 7.89¢ 8.35¢ 8.07¢ 7.94¢
Scheduled Service Only
Operating Expense Per Available Seat Mile
1991 1992 1993 1994 1995
6.76¢ 7.03¢ 7.25¢ 7.08¢ 7.07¢
Scheduled Service Only