Southwest Airlines 1995 Annual Report Download - page 2
Download and view the complete annual report
Please find page 2 of the 1995 Southwest Airlines annual report below. You can navigate through the pages in the report by either clicking on the pages listed below, or by using the keyword search tool below to find specific information within the annual report.-
 1
1 -
 2
2 -
 3
3 -
 4
4 -
 5
5 -
 6
6 -
 7
7 -
 8
8 -
 9
9 -
 10
10 -
 11
11 -
 12
12 -
 13
13 -
14
-
15
-
16
-
17
-
18
-
19
-
20
-
21
-
22
-
23
-
24
-
25
-
26
-
27
-
28
-
29
-
30
-
31
-
32
-
33
-
34
-
35
-
36
-
37
-
38
-
39
-
40
-
41
-
42
-
43
-
44
-
45
-
46
 |
 |

2
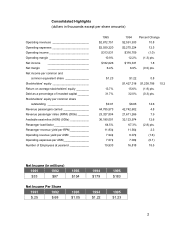
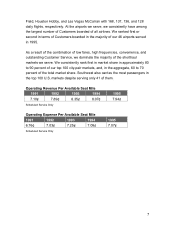
Consolidated Highlights
(dollars in thousands except per share amounts)
1995 1994 Percent Change
Operating revenues _______________________ $2,872,751 $2,591,933 10.8
Operating expenses _______________________ $2,559,220 $2,275,224 12.5
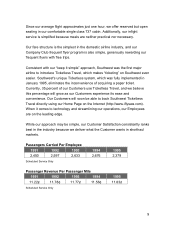
Operating income _________________________ $313,531 $316,709 (1.0)
Operating margin _________________________ 10.9% 12.2% (1.3) pts.
Net income __________________________ $182,626 $179,331 1.8
Net margin __________________________ 6.4% 6.9% (0.5) pts.
Net income per common and
common equivalent share _______________ $1.23 $1.22 0.8
Stockholders’ equity _______________________ $1,427,318 $1,238,706 15.2
Return on average stockholders’ equity ________ 13.7% 15.6% (1.9) pts.
Debt as a percentage of invested capital _______ 31.7% 32.0% (0.3) pts.
Stockholders’ equity per common share
outstanding __________________________ $9.91 $8.65 14.6
Revenue passengers carried ________________ 44,785,573 42,742,602 4.8
Revenue passenger miles (RPM) (000s) _______ 23,327,804 21,611,266 7.9
Available seat miles (ASM) (000s) ____________ 36,180,001 32,123,974 12.6
Passenger load factor ______________________ 64.5% 67.3% (2.8) pts.
Passenger revenue yield per RPM ____________ 11.83¢ 11.56¢ 2.3
Operating revenue yield per ASM ____________ 7.94¢ 8.07¢ (1.6)
Operating expenses per ASM________________ 7.07¢ 7.08¢ (0.1)
Number of Employees at yearend ____________ 19,933 16,818 18.5
Net Income (in millions)
1991 1992 1993 1994 1995
$33 $97 $154 $179 $183
Net Income Per Share
1991 1992 1993 1994 1995
$.25 $.68 $1.05 $1.22 $1.23