Shutterfly 2015 Annual Report Download - page 65
Download and view the complete annual report
Please find page 65 of the 2015 Shutterfly annual report below. You can navigate through the pages in the report by either clicking on the pages listed below, or by using the keyword search tool below to find specific information within the annual report.-
 1
1 -
2
-
3
-
4
-
5
-
6
-
7
-
8
-
9
-
10
-
11
-
12
-
13
-
14
-
15
-
16
-
17
-
18
-
19
-
20
-
21
-
22
-
23
-
24
-
25
-
26
-
27
-
28
-
29
-
30
-
31
-
32
-
33
-
34
-
35
-
36
-
37
-
38
-
39
-
40
-
41
-
42
-
43
-
44
-
45
-
46
-
47
-
48
-
49
-
50
-
51
-
52
-
53
-
54
-
 55
55 -
 56
56 -
 57
57 -
 58
58 -
 59
59 -
 60
60 -
 61
61 -
 62
62 -
 63
63 -
 64
64 -
 65
65 -
 66
66 -
 67
67 -
 68
68 -
 69
69 -
 70
70 -
 71
71 -
 72
72 -
 73
73 -
 74
74 -
 75
75 -
76
-
77
-
78
-
79
-
80
-
81
-
82
-
83
-
84
-
85
-
86
-
87
-
88
-
89
-
90
-
91
-
92
-
93
-
94
-
95
-
96
-
97
-
98
-
99
-
100
-
101
-
102
-
103
-
104
-
105
-
106
-
107
-
108
-
109
-
110
-
111
-
112
-
113
-
114
-
115
-
116
-
117
-
118
-
119
-
120
-
121
-
122
-
123
-
124
-
125
-
126
-
127
-
128
-
129
-
130
-
131
-
132
 |
 |

increase our production capacity, and help enable us to respond more quickly and efficiently to customer
demand. This range of capital expenditures is not outside the ordinary course of our business or materially
different from how we have expanded our business in the past.
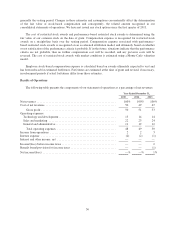
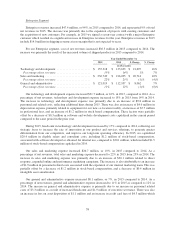
The following table shows total capital expenditures including amounts accrued but not yet paid by category
for the years ended December 31, 2015, 2014 and 2013:
Year Ended December 31,
2015 2014 2013
(in thousands)
Technology equipment and software ...................... $ 36,380 $ 37,711 $ 31,935
Percentage of total capital expenditures ................. 45% 42% 42%
Manufacturing equipment and building improvements ........ 18,478 26,872 26,880
Percentage of total capital expenditures ................. 23% 30% 36%
Capitalized technology and development costs .............. 22,113 21,748 15,760
Percentage of total capital expenditures ................. 27% 24% 21%
Rental Equipment ..................................... 4,407 3,912 395
Percentage of total capital expenditures ................. 5% 4% 1%
Total Capital Expenditures ................................ $ 81,378 $ 90,243 $ 74,970
Total Capital Expenditures percentage of net revenues ....... 8% 10% 10%
Operating Activities. For 2015, net cash provided by operating activities was $165.0 million. Adjustments
for non-cash items included $86.3 million of depreciation and amortization, which increased by $21.4 million
over the prior year due to an increase in equipment capital leases and additional built-to-suit lease arrangements
during the year. Additional adjustments for non-cash items included $60.5 million of stock-based compensation,
and $27.0 million of amortization of intangible assets. Net cash provided by operating activities was also
adjusted for amortization of debt discount and transaction costs of $13.6 million and the net change in operating
assets and liabilities of $19.4 million primarily driven by a change in accounts receivable resulting from
Enterprise customers.
For 2014, net cash provided by operating activities was $166.5 million, primarily due to our net loss of $7.9
million and adjustments for non-cash items including $64.9 million of depreciation and amortization, $61.8
million of stock-based compensation, and $33.9 million of amortization of intangible assets. Net cash provided
by operating activities was also adjusted for amortization of debt discount and transaction costs of $12.9 million
and the net change in operating assets and liabilities of $4.4 million.
For 2013, net cash provided by operating activities was $147.3 million, primarily due to our net income of
$9.3 million and adjustments for non-cash items including $53.5 million of stock-based compensation, $43.9
million of depreciation and amortization, and $31.0 million of amortization of intangible assets. Net cash
provided by operating activities was also adjusted for amortization of debt discount and transaction costs of $7.7
million and the net change in operating assets and liabilities of $2.2 million.
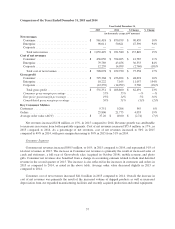
Investing Activities. For 2015, net cash used in investing activities was $33.1 million. We used $31.1
million to purchase investments, $55.4 million for capital expenditures for computer and network hardware to
support our website infrastructure and information technology systems, and for production equipment for our
manufacturing operations, and $21.2 million for capitalized software and website development. This was
partially offset from proceeds from the sales and maturities of investments of $73.5 million and proceeds from
the sale of equipment and rental assets of $1.3 million, respectively.
63