Shutterfly 2015 Annual Report Download - page 59
Download and view the complete annual report
Please find page 59 of the 2015 Shutterfly annual report below. You can navigate through the pages in the report by either clicking on the pages listed below, or by using the keyword search tool below to find specific information within the annual report.-
 1
1 -
2
-
3
-
4
-
5
-
6
-
7
-
8
-
9
-
10
-
11
-
12
-
13
-
14
-
15
-
16
-
17
-
18
-
19
-
20
-
21
-
22
-
23
-
24
-
25
-
26
-
27
-
28
-
29
-
30
-
31
-
32
-
33
-
34
-
35
-
36
-
37
-
38
-
39
-
40
-
41
-
42
-
43
-
44
-
45
-
46
-
47
-
48
-
 49
49 -
 50
50 -
 51
51 -
 52
52 -
 53
53 -
 54
54 -
 55
55 -
 56
56 -
 57
57 -
 58
58 -
 59
59 -
 60
60 -
 61
61 -
 62
62 -
 63
63 -
 64
64 -
 65
65 -
 66
66 -
 67
67 -
 68
68 -
 69
69 -
70
-
71
-
72
-
73
-
74
-
75
-
76
-
77
-
78
-
79
-
80
-
81
-
82
-
83
-
84
-
85
-
86
-
87
-
88
-
89
-
90
-
91
-
92
-
93
-
94
-
95
-
96
-
97
-
98
-
99
-
100
-
101
-
102
-
103
-
104
-
105
-
106
-
107
-
108
-
109
-
110
-
111
-
112
-
113
-
114
-
115
-
116
-
117
-
118
-
119
-
120
-
121
-
122
-
123
-
124
-
125
-
126
-
127
-
128
-
129
-
130
-
131
-
132
 |
 |

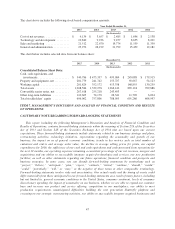
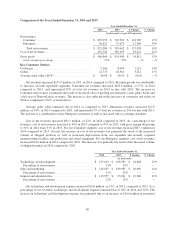
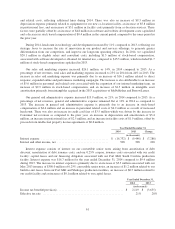
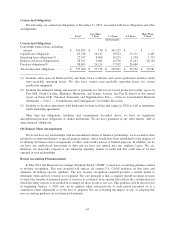
Comparison of the Years Ended December 31, 2015 and 2014
Year Ended December 31,
2015 2014 $ Change % Change
(in thousands, except AOV amounts)
Net revenues
Consumer .................................. $ 961,418 $ 870,959 $ 90,459 10%
Enterprise .................................. 98,011 50,621 47,390 94%
Corporate ................................... — — — —
Total net revenues .......................... $ 1,059,429 $ 921,580 $ 137,849 15%
Cost of net revenues
Consumer .................................. $ 436,050 $ 394,265 $ 41,785 11%
Enterprise .................................. 79,789 43,456 36,333 84%
Corporate ................................... 12,239 14,999 (2,760) (18)%
Total cost of net revenues .................... $ 528,078 $ 452,720 $ 75,358 17%
Gross profit
Consumer .................................. $ 525,368 $ 476,694 $ 48,674 10%
Enterprise .................................. 18,222 7,165 11,057 154%
Corporate ................................... (12,239) (14,999) 2,760 (18)%
Total gross profit ........................... $ 531,351 $ 468,860 $ 62,491 13%
Consumer gross margin percentage .............. 55% 55% —% —%
Enterprise gross margin percentage .............. 19% 14% 5% 36%
Consolidated gross margin percentage ........... 50% 51% (1)% (2)%
Key Consumer Metrics
Customers .................................... 9,751 9,206 545 6%
Orders ....................................... 25,806 21,773 4,033 19%
Average order value (AOV) ...................... $ 37.26 $ 40.00 $ (2.74) (7)%
Net revenues increased $138 million, or 15%, in 2015 compared to 2014. Revenue growth was attributable
to increases in revenue from both reportable segments. Cost of net revenues increased $75.4 million, or 17%, in
2015 compared to 2014. As a percentage of net revenues, cost of net revenues increased to 50% in 2015
compared to 49% in 2014, with gross margin decreasing to 50% in 2015 from 51% in 2014.
Consumer Segment
Consumer net revenues increased $90.5 million, or 10%, in 2015 compared to 2014, and represented 91% of
total net revenues in 2015. The increase in Consumer net revenues is primarily the result of increased sales of
cards and stationary, a full year of Groovebook sales (acquired in October 2014), mobile revenue, and photo
gifts. Consumer net revenues also benefited from a change in accounting estimate related to flash deal deferred
revenue in the second quarter of 2015. The increase is also reflected in the increases in customers and orders in
2015 as compared to 2014, as noted in the above table. Average order value decreased slightly in 2015 as
compared to 2014.
Consumer cost of net revenues increased $41.8 million in 2015 compared to 2014. Overall, the increase in
cost of net revenues was primarily the result of the increased volume of shipped products as well as increased
depreciation from our expanded manufacturing facilities and recently acquired production and rental equipment.
57