Sharp 2006 Annual Report Download - page 53
Download and view the complete annual report
Please find page 53 of the 2006 Sharp annual report below. You can navigate through the pages in the report by either clicking on the pages listed below, or by using the keyword search tool below to find specific information within the annual report.-
 1
1 -
2
-
3
-
4
-
5
-
6
-
7
-
8
-
9
-
10
-
11
-
12
-
13
-
14
-
15
-
16
-
17
-
18
-
19
-
20
-
21
-
22
-
23
-
24
-
25
-
26
-
27
-
28
-
29
-
30
-
31
-
32
-
33
-
34
-
35
-
36
-
37
-
38
-
39
-
40
-
41
-
42
-
 43
43 -
 44
44 -
 45
45 -
 46
46 -
 47
47 -
 48
48 -
 49
49 -
 50
50 -
 51
51 -
 52
52 -
 53
53 -
 54
54 -
 55
55 -
 56
56 -
 57
57 -
 58
58
 |
 |

SHARP ANNUAL REPORT 2006 52
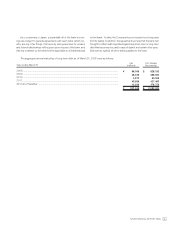
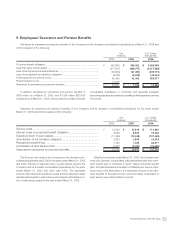
Corporate assets as of March 31, 2005 and 2006 were
¥500,047 million and ¥447,139 million ($3,854,647 thousand),
respectively, and were mainly comprised of the Company’s cash
and cash equivalents and investments in securities.
Effective for the year ended March 31, 2006, the consolidated
subsidiaries in the United Kingdom adopted a new accounting
standard for retirement benefits in the United Kingdom, resulted in
immaterial impact on the segment information.
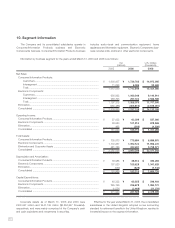
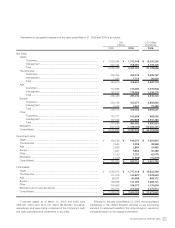
Information by geographic segment for the years ended March 31, 2005 and 2006 is as follows:
Net Sales:
Japan:
Customers..........................................................................................
Intersegment ......................................................................................
Total...................................................................................................
The Americas:
Customers..........................................................................................
Intersegment ......................................................................................
Total ..................................................................................................
Asia:
Customers .........................................................................................
Intersegment ......................................................................................
Total ..................................................................................................
Europe:
Customers .........................................................................................
Intersegment ......................................................................................
Total ..................................................................................................
Other:
Customers..........................................................................................
Intersegment ......................................................................................
Total...................................................................................................
Elimination...................................................................................................
Consolidated ...............................................................................................
Operating Income:
Japan ..........................................................................................................
The Americas ..............................................................................................
Asia .............................................................................................................
Europe ........................................................................................................
Other...........................................................................................................
Elimination...................................................................................................
Consolidated ...............................................................................................
Total Assets:
Japan ..........................................................................................................
The Americas ..............................................................................................
Asia .............................................................................................................
Europe ........................................................................................................
Other...........................................................................................................
Elimination and Corporate Assets ................................................................
Consolidated ...............................................................................................
$ 15,020,250
6,109,405
21,129,655
3,526,767
66,509
3,593,276
1,005,948
1,539,276
2,545,224
3,666,992
31,569
3,698,561
893,052
2,507,482
3,400,534
(10,254,241)
$ 24,113,009
$ 1,261,810
28,948
24,853
50,483
62,078
(16,879)
$ 1,411,293
$ 15,322,569
1,229,543
698,172
1,269,741
1,175,604
2,375,914
$ 22,071,543
¥ 1,742,349
708,691
2,451,040
409,105
7,715
416,820
116,690
178,556
295,246
425,371
3,662
429,033
103,594
290,868
394,462
(1,189,492)
¥ 2,797,109
¥ 146,370
3,358
2,883
5,856
7,201
(1,958)
¥ 163,710
¥ 1,777,418
142,627
80,988
147,290
136,370
275,606
¥ 2,560,299
¥ 1,626,944
629,484
2,256,428
338,342
7,858
346,200
110,658
158,828
269,486
353,198
2,975
356,173
110,717
167,929
278,646
(967,074)
¥ 2,539,859
¥ 138,769
2,544
2,653
1,947
6,133
(1,026)
¥ 151,020
¥ 1,585,073
131,016
68,201
135,068
100,698
364,970
¥ 2,385,026
200620062005
Yen
(millions) U.S. Dollars
(thousands)