Sharp 2006 Annual Report Download - page 33
Download and view the complete annual report
Please find page 33 of the 2006 Sharp annual report below. You can navigate through the pages in the report by either clicking on the pages listed below, or by using the keyword search tool below to find specific information within the annual report.-
 1
1 -
2
-
3
-
4
-
5
-
6
-
7
-
8
-
9
-
10
-
11
-
12
-
13
-
14
-
15
-
16
-
17
-
18
-
19
-
20
-
21
-
22
-
 23
23 -
 24
24 -
 25
25 -
 26
26 -
 27
27 -
 28
28 -
 29
29 -
 30
30 -
 31
31 -
 32
32 -
 33
33 -
 34
34 -
 35
35 -
 36
36 -
 37
37 -
 38
38 -
 39
39 -
 40
40 -
 41
41 -
 42
42 -
 43
43 -
44
-
45
-
46
-
47
-
48
-
49
-
50
-
51
-
52
-
53
-
54
-
55
-
56
-
57
-
58
 |
 |
SHARP ANNUAL REPORT 2006 32
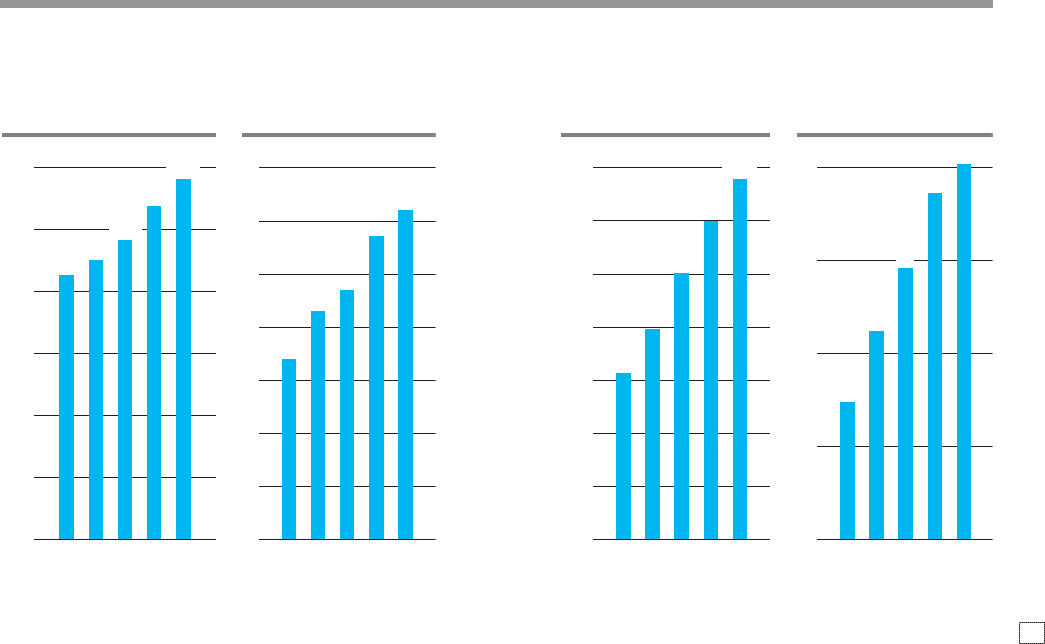
02 03 04 0605
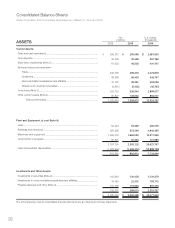
57
62
34
43
47
0
10
20
30
40
50
60
70
02 03 04 0605
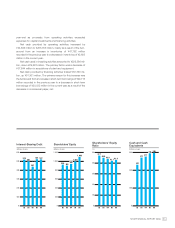
1,279
1,352
1,447
1,612
1,742
0
300
600
900
1,200
1,500
1,800
02 03 04 0605
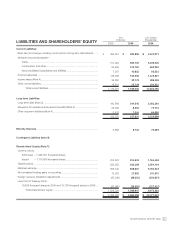
1,197
1,358
625
793
1,004
0
200
400
600
800
1,000
1,200
1,400
02 03 04 0605
0
25
50
75
100
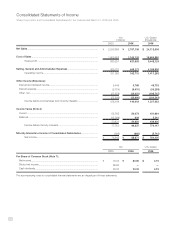
101
37
56
73
93
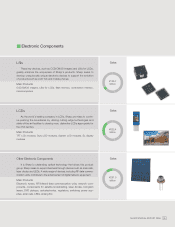
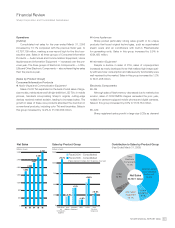
for TVs and mobile equipment, as well as in solar cells. As a result,
sales increased by 8.6% over the previous year to ¥2,451,040 mil-
lion. Operating income rose by 5.5% to ¥146,370 million.
In the Americas, strong sales of LCD TVs, copier/printers, LCDs
and solar cells led to a 20.4% increase in regional sales to ¥416,820
million. Operating income rose by 32.0% to ¥3,358 million.
In Asia, sales increased by 9.6% to ¥295,246 million on account
of growth in sales of LCDs. Operating income amounted to
¥2,883 million, up 8.7%.
In Europe, sales of LCD TVs, LCDs, solar cells and
CCD/CMOS imagers performed well. Overall sales in Europe climbed
20.5% to ¥429,033 million, while operating income jumped
200.8% to ¥5,856 million.
In Other, brisk sales of copier/printers and LCDs pushed over-
all sales up 41.6% year-on-year to ¥394,462 million. Operating
income rose by 17.4% to ¥7,201 million.
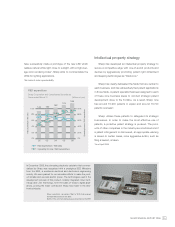
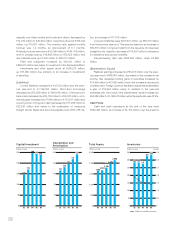
Capital Investment* and Depreciation
Capital investment for the year was ¥238,839 million, down 1.9%
from the previous year. The majority of this was aggressive invest-
ment in LCDs, the core business of Sharp, including enhancement
of the production lines at the Kameyama No. 1 Plant, construction
of the Kameyama No. 2 Plant and capacity increase for System
LCDs at the Mie No. 3 Plant. Other investments were made to
upgrade the production capacity for solar cells and to strengthen
production facilities at overseas subsidiaries in China and the
Americas.
With regard to capital investment by business segment,
Consumer/Information Products was ¥35,178 million and Electronic
Components was ¥203,661 million.
Depreciation and amortization increased by 9.7% to ¥193,114
million.
* The amount of properties for lease is included in capital investment.
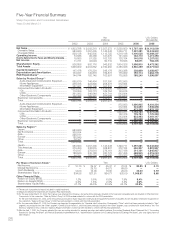
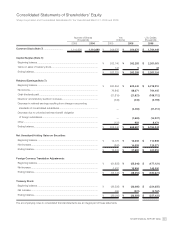
Financial Position
Total assets increased by ¥175,273 million over the previous
year-end to ¥2,560,299 million.
[Assets]
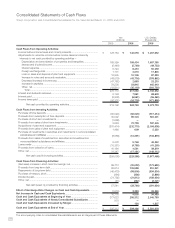
Current assets amounted to ¥1,394,873 million, an increase
of ¥74,260 million over the previous year-end. Cash and cash equiv-
alents rose by ¥4,154 million to ¥299,466 million and notes and
accounts receivable increased by ¥75,757 million to ¥578,699 mil-
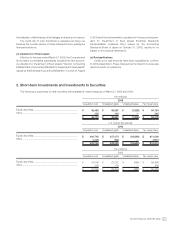
lion. Meanwhile, short-term investments, including certificates of
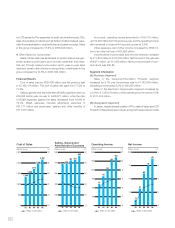
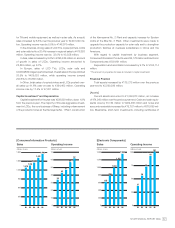
Operating IncomeSales Sales Operating Income
[Consumer/Information Products] [Electronic Components]
(billions of yen) (billions of yen) (billions of yen) (billions of yen)