Sharp 2006 Annual Report Download - page 35
Download and view the complete annual report
Please find page 35 of the 2006 Sharp annual report below. You can navigate through the pages in the report by either clicking on the pages listed below, or by using the keyword search tool below to find specific information within the annual report.-
 1
1 -
2
-
3
-
4
-
5
-
6
-
7
-
8
-
9
-
10
-
11
-
12
-
13
-
14
-
15
-
16
-
17
-
18
-
19
-
20
-
21
-
22
-
23
-
24
-
 25
25 -
 26
26 -
 27
27 -
 28
28 -
 29
29 -
 30
30 -
 31
31 -
 32
32 -
 33
33 -
 34
34 -
 35
35 -
 36
36 -
 37
37 -
 38
38 -
 39
39 -
 40
40 -
 41
41 -
 42
42 -
 43
43 -
 44
44 -
 45
45 -
46
-
47
-
48
-
49
-
50
-
51
-
52
-
53
-
54
-
55
-
56
-
57
-
58
 |
 |
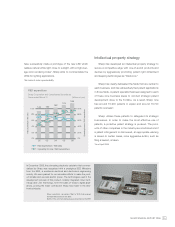
0
10
20
30
40
50
02 03 04 0605
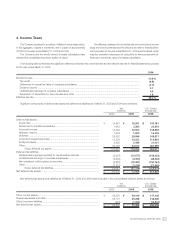
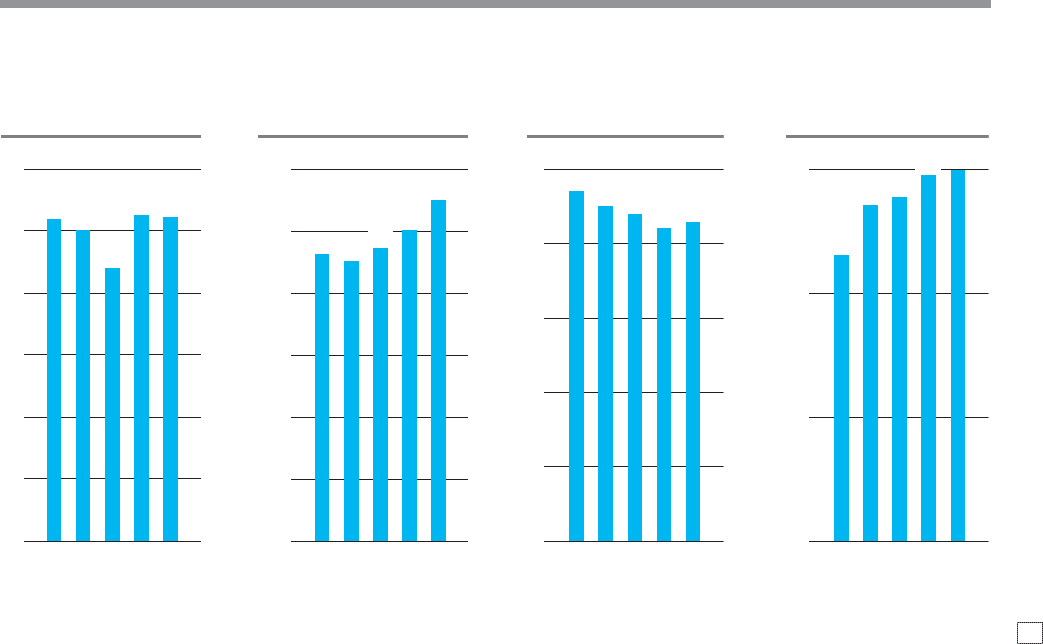
42.1 42.9
47.1
45.0 43.9
02 03 04 0605
926 902
943
1,004
1,098
0
200
400
600
800
1,000
1,200
02 03 04 0605
525 522
519 501
441
0
100
200
300
400
500
600
02 03 04 0605
295
231
271 277
0
100
200
300 299
SHARP ANNUAL REPORT 2006 34
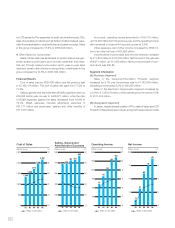
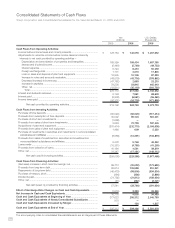
year-end as proceeds from operating activities exceeded
expenses for capital investments and financing activities.
Net cash provided by operating activities increased by
¥44,555 million to ¥263,753 million, mainly as a result of the turn-
around from an increase in inventories of ¥47,762 million
recorded in the previous year to a decrease in inventories of ¥2,693
million in the current year.
Net cash used in investing activities amounted to ¥229,386 mil-
lion, down ¥29,622 million. The primary factor was a decrease of
¥37,644 million in acquisitions of plant and equipment.
Net cash provided by financing activities totaled ¥33,760 mil-
lion, up ¥91,301 million. The primary reason for this increase was
the turnaround from an increase in short-term borrowings of ¥99,713
million recorded in the previous year to a decrease in short-term
borrowings of ¥20,032 million in the current year as a result of the
decrease in commercial paper, net.
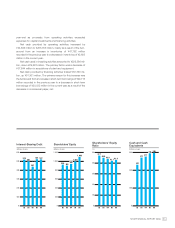
Shareholders’ Equity
Ratio
Shareholders’ Equity
Interest-Bearing Debt Cash and Cash
Equivalents
(billions of yen) (billions of yen) (billions of yen)(%)