Sharp 2005 Annual Report Download - page 50
Download and view the complete annual report
Please find page 50 of the 2005 Sharp annual report below. You can navigate through the pages in the report by either clicking on the pages listed below, or by using the keyword search tool below to find specific information within the annual report.-
 1
1 -
2
-
3
-
4
-
5
-
6
-
7
-
8
-
9
-
10
-
11
-
12
-
13
-
14
-
15
-
16
-
17
-
18
-
19
-
20
-
21
-
22
-
23
-
24
-
25
-
26
-
27
-
28
-
29
-
30
-
31
-
32
-
33
-
34
-
35
-
36
-
37
-
38
-
39
-
 40
40 -
 41
41 -
 42
42 -
 43
43 -
 44
44 -
 45
45 -
 46
46 -
 47
47 -
 48
48 -
 49
49 -
 50
50 -
 51
51 -
 52
52 -
 53
53 -
 54
54
 |
 |

SHARP ANNUAL REPORT 200545
200520052004
Yen
(millions) U.S. Dollars
(thousands)
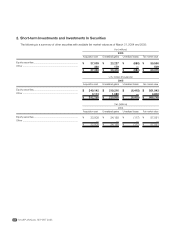
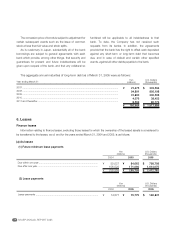
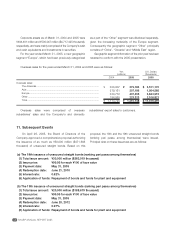
Overseas sales were comprised of overseas
subsidiaries’ sales and the Company’s and domestic
subsidiaries’ export sales to customers.
Overseas sales:
The Americas............................................................................................
Asia ..........................................................................................................
Europe......................................................................................................
Other ........................................................................................................
Total .........................................................................................................
$ 3,511,170
1,954,585
3,843,915
2,106,821
$ 11,416,491
¥ 372,184
207,186
407,455
223,323
¥ 1,210,148
¥ 308,807
279,161
330,772
194,985
¥ 1,113,725
Overseas sales for the years ended March 31, 2004 and 2005 were as follows:
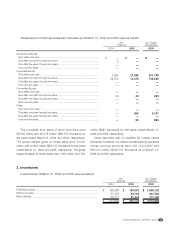
Corporate assets as of March 31, 2004 and 2005 were
¥494,401 million and ¥500,047 million ($4,717,425 thousand),
respectively, and were mainly comprised of the Company’s cash
and cash equivalents and investments in securities.
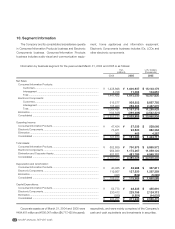
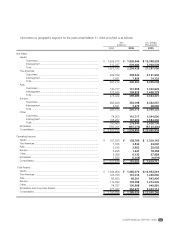
For the year ended March 31, 2005, a new geographic
segment “Europe”, which had been previously categorized
as a part of the “Other” segment was disclosed separately,
given the increasing materiality of the Europe segment.
Consequently the geographic segment “Other” principally
consists of “China”, “Oceania” and “Middle East” region.
Geographic segment information of the prior year has been
restated to conform with the 2005 presentation.
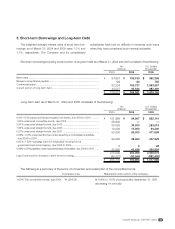
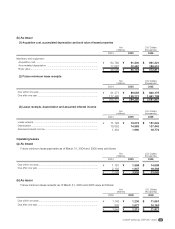
On April 26, 2005, the Board of Directors of the
Company approved a comprehensive proposal authorizing
the issuance of as much as ¥50,000 million ($471,698
thousand) of unsecured straight bonds. Based on this
proposal, the 18th and the 19th unsecured straight bonds
(ranking pari passu among themselves) were issued.
Principal data on these issuances are as follows:
11. Subsequent Events
(a) The 18th issuance of unsecured straight bonds (ranking pari passu among themselves)
(1) Total issue amount: ¥30,000 million ($283,019 thousand)
(2) Issue price: ¥99.95 for each ¥100 of face value
(3) Payment date: May 31, 2005
(4) Redemption date: June 21, 2010
(5) Interest rate: 0.62%
(6) Application of funds: Repayment of bonds and funds for plant and equipment
(b) The 19th issuance of unsecured straight bonds (ranking pari passu among themselves)
(1) Total issue amount: ¥20,000 million ($188,679 thousand)
(2) Issue price: ¥99.95 for each ¥100 of face value
(3) Payment date: May 31, 2005
(4) Redemption date: June 20, 2012
(5) Interest rate: 0.97%
(6) Application of funds: Repayment of bonds and funds for plant and equipment