Sharp 2005 Annual Report Download - page 26
Download and view the complete annual report
Please find page 26 of the 2005 Sharp annual report below. You can navigate through the pages in the report by either clicking on the pages listed below, or by using the keyword search tool below to find specific information within the annual report.-
 1
1 -
2
-
3
-
4
-
5
-
6
-
7
-
8
-
9
-
10
-
11
-
12
-
13
-
14
-
15
-
 16
16 -
 17
17 -
 18
18 -
 19
19 -
 20
20 -
 21
21 -
 22
22 -
 23
23 -
 24
24 -
 25
25 -
 26
26 -
 27
27 -
 28
28 -
 29
29 -
 30
30 -
 31
31 -
 32
32 -
 33
33 -
 34
34 -
 35
35 -
 36
36 -
37
-
38
-
39
-
40
-
41
-
42
-
43
-
44
-
45
-
46
-
47
-
48
-
49
-
50
-
51
-
52
-
53
-
54
 |
 |

SHARP ANNUAL REPORT 200521
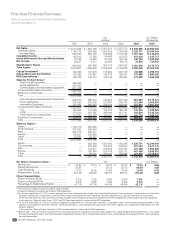
Five-Year Financial Summary
Sharp Corporation and Consolidated Subsidiaries
Years Ended March 31
200520052004200320012001
Yen
(millions) U.S. Dollars
(thousands)
*1 The amount of properties for lease is included in capital investment.
*2 Design and development expenses are included in R&D expenditures.
*3 For the year ended March 31, 2002, product groupings have been recategorized and changed from Audio-Visual Equipment, Home Appliances, Communication and Information
Equipment, and Electronics Components to Audio-Visual and Communication Equipment, Home Appliances, Information Equipment, ICs, LCDs and Other Electronic Components.
For the year ended March 31, 2003, some items previously included in Audio-Visual and Communication Equipment have been recategorized and are included in Information Equipment.
In this connection, “Sales by Product Group” of 2001 and 2002 have been restated to conform with the 2003 presentation.
*4 For the year ended March 31, 2003, the Company recategorized its segmentation for “Overseas sales” information. Consequently “China”, which had been previously included in “Asia”
segment, was reclassified into the “Other” segment. “Central & South America”, which had been previously included in the “Other” segment, was combined with “North America” into “The
Americas” segment.
In this connection, “Sales by Region” information of 2002 has been restated to conform with the 2003 presentation.
*5 Effective April 1, 2002, the Company adopted the new accounting standard for earnings per share and related guidance (Accounting Standards Board Statement No.2, “Accounting
Standard for Earnings Per Share” and Financial Standards Implementation Guidance No.4, “Implementation Guidance for Accounting Standard for Earnings Per Share”), prior year figures
have not been restated.
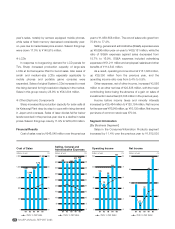
Net Sales .........................................................
Domestic Sales ..............................................
Overseas Sales ..............................................
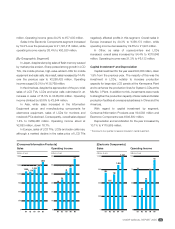
Operating Income ...........................................
Income before Income Taxes and Minority Interests
...
Net Income......................................................
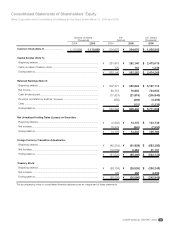
Shareholders’ Equity.......................................
Total Assets ....................................................
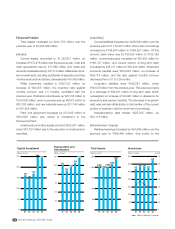
Capital Investment*1.......................................
Depreciation and Amortization.......................
R&D Expenditures*2........................................
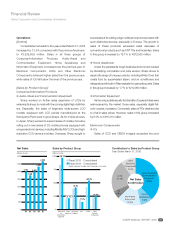
Sales by Product Group*3
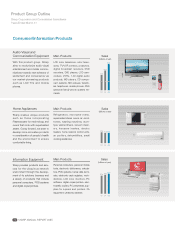
Audio-Visual Equipment ...............................
Home Appliances.........................................
Communication and Information Equipment ...
Consumer/Information Products .....................
Electronic Components...................................
Total ...............................................................
Audio-Visual and Communication Equipment
....
Home Appliances.........................................
Information Equipment .................................
Consumer/Information Products .....................
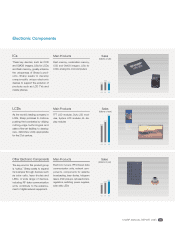
ICs ..............................................................
LCDs ..........................................................
Other Electronic Components .....................
Electronic Components...................................
Total ...............................................................
Sales by Region*4
Japan..............................................................
North America.................................................
Asia.................................................................
Europe............................................................
Other ..............................................................
Total ...............................................................
Japan..............................................................
The Americas..................................................
Asia.................................................................
Europe............................................................
Other ..............................................................
Total ...............................................................
Per Share of Common Stock*5
Net Income .....................................................
Diluted Net Income .........................................
Cash Dividends ..............................................
Shareholders’ Equity .......................................
Other Financial Data
Return on Equity (ROE) ...................................
Return on Assets (ROA) ..................................
Percentage of Shareholders’ Equity ..................
$ 23,960,934
12,544,443
11,416,491
1,424,717
1,209,283
724,953
9,474,773
22,500,245
2,296,113
1,660,085
1,656,208
—
—
—
—
—
—
9,175,122
2,000,604
3,927,453
15,103,179
1,329,387
5,130,226
2,398,142
8,857,755
23,960,934
—
—
—
—
—
—
12,544,443
3,511,170
1,954,585
3,843,915
2,106,821
23,960,934
$ 0.66
0.66
0.19
8.68
—
—
—
¥ 2,539,859
1,329,711
1,210,148
151,020
128,184
76,845
1,004,326
2,385,026
243,388
175,969
175,558
—
—
—
—
—
—
972,563
212,064
416,310
1,600,937
140,915
543,804
254,203
938,922
2,539,859
—
—
—
—
—
—
1,329,711
372,184
207,186
407,455
223,323
2,539,859
¥ 70.04
69.60
20.00
920.09
7.9%
3.4%
42.1%
¥ 2,257,273
1,143,548
1,113,725
121,670
102,720
60,715
943,532
2,150,250
248,178
159,831
162,991
—
—
—
—
—
—
837,390
208,473
392,833
1,438,696
169,754
421,741
227,082
818,577
2,257,273
—
—
—
—
—
—
1,143,548
308,807
279,161
330,772
194,985
2,257,273
¥ 55.37
54.73
18.00
864.77
6.6%
2.9%
43.9%
¥ 2,003,210
1,057,405
945,805
99,466
57,325
32,594
902,116
2,004,832
170,254
145,818
152,145
—
—
—
—
—
—
746,404
223,890
376,106
1,346,400
124,773
346,646
185,391
656,810
2,003,210
—
—
—
—
—
—
1,057,405
336,815
270,618
235,168
103,204
2,003,210
¥ 29.37
29.15
15.00
827.51
3.6%
1.6%
45.0%
¥ 1,803,798
983,660
820,138
73,585
19,863
11,311
926,856
1,966,909
147,478
133,947
144,744
—
—
—
—
—
—
655,679
236,335
382,062
1,274,076
116,099
261,295
152,328
529,722
1,803,798
983,660
369,934
225,017
188,840
36,347
1,803,798
983,660
370,490
174,017
188,840
86,791
1,803,798
¥ 10.10
—
14.00
834.56
1.2%
0.6%
47.1%
¥ 2,012,858
1,149,775
863,083
105,913
70,724
38,527
943,505
2,003,641
162,393
152,455
149,722
389,464
252,950
641,438
1,283,852
729,006
2,012,858
629,870
252,950
401,032
1,283,852
180,604
374,520
173,882
729,006
2,012,858
1,149,775
377,062
252,179
190,521
43,321
2,012,858
—
—
—
—
—
—
¥ 34.20
33.87
13.00
837.45
4.2%
2.0%
47.1%
Yen U.S. Dollars