Sharp 2005 Annual Report Download - page 48
Download and view the complete annual report
Please find page 48 of the 2005 Sharp annual report below. You can navigate through the pages in the report by either clicking on the pages listed below, or by using the keyword search tool below to find specific information within the annual report.-
 1
1 -
2
-
3
-
4
-
5
-
6
-
7
-
8
-
9
-
10
-
11
-
12
-
13
-
14
-
15
-
16
-
17
-
18
-
19
-
20
-
21
-
22
-
23
-
24
-
25
-
26
-
27
-
28
-
29
-
30
-
31
-
32
-
33
-
34
-
35
-
36
-
37
-
 38
38 -
 39
39 -
 40
40 -
 41
41 -
 42
42 -
 43
43 -
 44
44 -
 45
45 -
 46
46 -
 47
47 -
 48
48 -
 49
49 -
 50
50 -
 51
51 -
 52
52 -
 53
53 -
 54
54
 |
 |

SHARP ANNUAL REPORT 200543
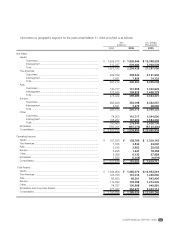
Net Sales:
Consumer/Information Products:
Customers..............................................................................................
Intersegment ..........................................................................................
Total .......................................................................................................
Electronic Components:
Customers..............................................................................................
Intersegment ..........................................................................................
Total .......................................................................................................
Elimination .....................................................................................................
Consolidated .................................................................................................
Operating Income:
Consumer/Information Products....................................................................
Electronic Components .................................................................................
Elimination .....................................................................................................
Consolidated .................................................................................................
Total Assets:
Consumer/Information Products....................................................................
Electronic Components .................................................................................
Elimination and Corporate Assets ..................................................................
Consolidated .................................................................................................
Depreciation and Amortization:
Consumer/Information Products....................................................................
Electronic Components .................................................................................
Elimination .....................................................................................................
Consolidated .................................................................................................
Capital Expenditures:
Consumer/Information Products....................................................................
Electronic Components .................................................................................
Elimination .....................................................................................................
Consolidated .................................................................................................
$ 15,103,179
104,651
15,207,830
8,857,755
2,437,670
11,295,425
(2,542,321)
$ 23,960,934
$ 538,066
882,264
4,387
$ 1,424,717
$ 6,895,972
11,059,122
4,545,151
$ 22,500,245
$ 367,811
1,297,359
(5,085)
$ 1,660,085
$ 455,991
2,124,113
(14,632)
$ 2,565,472
¥ 1,600,937
11,093
1,612,030
938,922
258,393
1,197,315
(269,486)
¥ 2,539,859
¥ 57,035
93,520
465
¥ 151,020
¥ 730,973
1,172,267
481,786
¥ 2,385,026
¥ 38,988
137,520
(539)
¥ 175,969
¥ 48,335
225,156
(1,551)
¥ 271,940
¥ 1,438,696
8,726
1,447,422
818,577
185,920
1,004,497
(194,646)
¥ 2,257,273
¥ 47,434
73,971
265
¥ 121,670
¥ 682,689
984,940
482,621
¥ 2,150,250
¥ 40,385
119,867
(421)
¥ 159,831
¥ 53,773
230,413
(929)
¥ 283,257
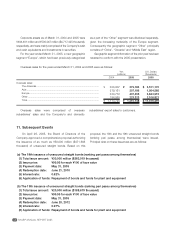
Corporate assets as of March 31, 2004 and 2005 were
¥494,401 million and ¥500,047 million ($4,717,425 thousand),
respectively, and were mainly comprised of the Company’s
cash and cash equivalents and investments in securities.
200520052004
Yen
(millions) U.S. Dollars
(thousands)
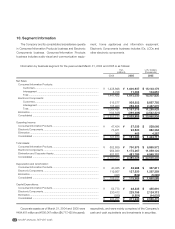
The Company and its consolidated subsidiaries operate
in Consumer/Information Products business and Electronic
Components business. Consumer/Information Products
business includes audio-visual and communication equip-
ment, home appliances and information equipment.
Electronic Components business includes ICs, LCDs and
other electronic components.
10. Segment Information
Information by business segment for the years ended March 31, 2004 and 2005 is as follows: