Public Storage 2014 Annual Report Download - page 6
Download and view the complete annual report
Please find page 6 of the 2014 Public Storage annual report below. You can navigate through the pages in the report by either clicking on the pages listed below, or by using the keyword search tool below to find specific information within the annual report.-
 1
1 -
 2
2 -
 3
3 -
 4
4 -
 5
5 -
 6
6 -
 7
7 -
 8
8 -
 9
9 -
 10
10 -
 11
11 -
 12
12 -
 13
13 -
 14
14 -
 15
15 -
 16
16 -
 17
17 -
18
-
19
-
20
-
21
-
22
-
23
-
24
-
25
-
26
-
27
-
28
-
29
-
30
-
31
-
32
-
33
-
34
-
35
-
36
-
37
-
38
-
39
-
40
-
41
-
42
-
43
-
44
-
45
-
46
-
47
-
48
-
49
-
50
-
51
-
52
-
53
-
54
-
55
-
56
-
57
-
58
-
59
-
60
-
61
-
62
-
63
-
64
-
65
-
66
-
67
-
68
-
69
-
70
-
71
-
72
-
73
-
74
-
75
-
76
-
77
-
78
-
79
-
80
-
81
-
82
-
83
-
84
-
85
-
86
-
87
-
88
-
89
-
90
-
91
-
92
-
93
-
94
-
95
-
96
-
97
-
98
-
99
-
100
-
101
-
102
-
103
-
104
-
105
-
106
-
107
-
108
-
109
-
110
-
111
-
112
-
113
-
114
-
115
-
116
 |
 |

3
U.S. Self-Storage
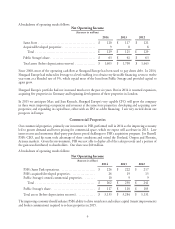
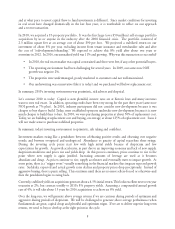
In 2014 our U.S. self-storage business, which generates 93% of revenues and 84% of net operating income,
continued to benefit from an improving economy and solid execution. In addition, new supply of
self-storage properties continues to be nominal relative to the estimated base of 2.3 billion square feet of
self-storage space nationally, producing ideal conditions for higher occupancies, better rental rates and lower
customer acquisition costs. When combined with our scale and low operating cost structure, we were able
to produce an almost 7% same store NOI growth. Our field and revenue management teams, led by Shawn
Weidmann and John Reyes, did an exceptional job in 2014 managing and pricing the one million spaces and
customers in this 125 million square feet group of properties.
Same Store Properties
(Amounts in millions, except sq. ft. occupancy and revenue per available foot)
2014 2013 2012
Revenues $ 1,837 $ 1,743 $ 1,653
Costs of operations 499 489 496
Net operating income $ 1,338 $ 1,254 $ 1,157
Sq. ft. occupancy 93.9% 93.3% 91.9%
Revenue per available foot (“REVPAF”) $ 13.94 $ 13.21 $ 12.52
Our group of “Other” self-storage properties consist of recent acquisitions, newly developed and
redeveloped properties. This group of properties has more than tripled in the last two years and will
be a source of continued growth. Last year, this group generated nearly half of the $150 million growth
in NOI from our U.S. self-storage portfolio.
Other Self-Storage Properties
(Amounts in millions, except sq. ft. occupancy and REVPAF)
2014 2013 2012
Revenues $ 213 $ 107 $ 66
Costs of operations 68 35 22
Net operating income $ 145 $ 72 $ 44
Sq. ft. 19.4 14.9 6.2
Sq. ft. occupancy 88.2% 85.6% 85.1%
REVPAF $ 12.25 $ 12.12 $ 12.88
A key risk to our business, like most other businesses, is a significant increase in competition, i.e., new supply of
self-storage space. Although there are no reliable industry statistics on new self-storage construction, current
estimates indicate approximately 100 new properties were built in 2014 with an additional 300 to 500
projected for 2015. This compares to the estimated 49,000 current facilities, containing approximately
2.3 billion square feet or about seven square feet per person. Assuming the U.S. population grows at 1.1%
per year, annual increases of 25 million square feet of new self-storage space (about 500 properties) would be
needed to maintain the current per capita ratio. As you would expect, strong revenue and NOI growth and low
cap rates precipitate new competition (basic laws of economics apply to the self-storage business).