Public Storage 2014 Annual Report Download - page 4
Download and view the complete annual report
Please find page 4 of the 2014 Public Storage annual report below. You can navigate through the pages in the report by either clicking on the pages listed below, or by using the keyword search tool below to find specific information within the annual report.-
 1
1 -
 2
2 -
 3
3 -
 4
4 -
 5
5 -
 6
6 -
 7
7 -
 8
8 -
 9
9 -
 10
10 -
 11
11 -
 12
12 -
 13
13 -
 14
14 -
 15
15 -
16
-
17
-
18
-
19
-
20
-
21
-
22
-
23
-
24
-
25
-
26
-
27
-
28
-
29
-
30
-
31
-
32
-
33
-
34
-
35
-
36
-
37
-
38
-
39
-
40
-
41
-
42
-
43
-
44
-
45
-
46
-
47
-
48
-
49
-
50
-
51
-
52
-
53
-
54
-
55
-
56
-
57
-
58
-
59
-
60
-
61
-
62
-
63
-
64
-
65
-
66
-
67
-
68
-
69
-
70
-
71
-
72
-
73
-
74
-
75
-
76
-
77
-
78
-
79
-
80
-
81
-
82
-
83
-
84
-
85
-
86
-
87
-
88
-
89
-
90
-
91
-
92
-
93
-
94
-
95
-
96
-
97
-
98
-
99
-
100
-
101
-
102
-
103
-
104
-
105
-
106
-
107
-
108
-
109
-
110
-
111
-
112
-
113
-
114
-
115
-
116
 |
 |

1
To the Shareholders of Public Storage:
PUBLIC STORAGE
(1) See accompanying schedule “Supplemental Non-GAAP Disclosures.”
We had an excellent year in 2014. Robust industry conditions and solid execution by our management teams
enabled us to improve our competitive position and drive shareholder value.
Key highlights for the year include:
• The U.S. self-storage business generated strong organic growth for the fourth consecutive year. Same
store revenue and net operating income
1
(“NOI”) growth were 5.4% and 6.7%, respectively. In
addition, our newer facilities continued to generate strong revenue growth and occupancy gains.
• We strengthened our market position by acquiring and developing 50 properties. We also expanded our
development pipeline to approximately $410 million at the end of 2014.
• Our ancillary businesses, which complement our U.S. self-storage business, continued to produce solid
results due to increased customer volume and solid execution.
• Shurgard Europe, which we own 49%, continued to improve its operating results, with the first
year-over-year increase in occupancy in seven years. Shurgard Europe’s management team executed
its first unsecured term financing and, as a result, lowered its cost of capital and enabled it to fund
several acquisitions and begin developing three new properties.
• PS Business Parks, Inc. (“PSB”), which we own approximately 42%, improved its market focus
and sold $210 million of properties, exiting the Portland and Phoenix markets. Gain from the sales
resulted in a special dividend to us of approximately $40 million. PSB’s operating results were solid
and should continue to improve in 2015.
• We further strengthened our fortress balance sheet by issuing $763 million of perpetual preferred securities
and retiring $770 million of debt. Debt to EBITDA, a common leverage metric, is now .04 to 1, the
lowest in our industry and in our history.
There is no doubt an improving economy helped our operating results. Overall, our combined revenues
increased to $2.8 billion from $2.6 billion. Most of this revenue increase dropped to the bottom line,
resulting in higher NOI and increased free cash flow
1
per share.
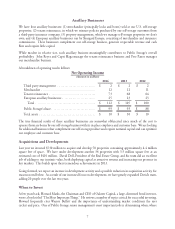
The key figures for our businesses are presented below as if we owned 100% of each.
Revenues1
(Amounts in millions)
2014 2013 2012
U.S. self-storage $ 2,050 $ 1,850 $ 1,719
European self-storage 224 218 223
Commercial properties 393 374 361
Ancillary businesses 159 146 139
Total $ 2,826 $ 2,588 $ 2,442