Public Storage 2014 Annual Report Download - page 5
Download and view the complete annual report
Please find page 5 of the 2014 Public Storage annual report below. You can navigate through the pages in the report by either clicking on the pages listed below, or by using the keyword search tool below to find specific information within the annual report.-
 1
1 -
 2
2 -
 3
3 -
 4
4 -
 5
5 -
 6
6 -
 7
7 -
 8
8 -
 9
9 -
 10
10 -
 11
11 -
 12
12 -
 13
13 -
 14
14 -
 15
15 -
 16
16 -
17
-
18
-
19
-
20
-
21
-
22
-
23
-
24
-
25
-
26
-
27
-
28
-
29
-
30
-
31
-
32
-
33
-
34
-
35
-
36
-
37
-
38
-
39
-
40
-
41
-
42
-
43
-
44
-
45
-
46
-
47
-
48
-
49
-
50
-
51
-
52
-
53
-
54
-
55
-
56
-
57
-
58
-
59
-
60
-
61
-
62
-
63
-
64
-
65
-
66
-
67
-
68
-
69
-
70
-
71
-
72
-
73
-
74
-
75
-
76
-
77
-
78
-
79
-
80
-
81
-
82
-
83
-
84
-
85
-
86
-
87
-
88
-
89
-
90
-
91
-
92
-
93
-
94
-
95
-
96
-
97
-
98
-
99
-
100
-
101
-
102
-
103
-
104
-
105
-
106
-
107
-
108
-
109
-
110
-
111
-
112
-
113
-
114
-
115
-
116
 |
 |

2
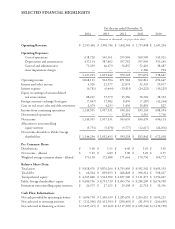
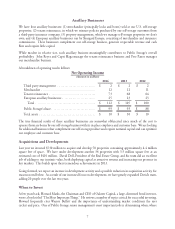
Net Operating Income
(Amounts in millions, except per share)
2014 2013 2012
U.S. self-storage $ 1,483 $ 1,326 $ 1,201
European self-storage 129 125 129
Commercial properties 262 250 241
Ancillary businesses 112 105 100
Total $ 1,986 $ 1,806 $ 1,671
Public Storage’s share $ 1,762 $ 1,590 $ 1,457
Free cash flow per share $ 7.73 $ 7.18 $ 6.41
Dividends per share $ 5.60 $ 5.15 $ 4.40
As noted in previous letters, our goal is to grow free cash flow per share on a long-term, sustainable basis. I
believe this is the best metric to calculate our intrinsic business value. It is also key to measuring long-term
managerial performance. It does not, however, capture other key attributes of our company such as brand, scale
and the quality of our properties and people that will, over time, enhance our intrinsic value.
In 2014, our 8% increase in free cash flow per share was lower than the ten year average of 11%. A couple of
reasons drove this decline, several of which we expect will persist in the near term.
First, Shurgard Europe repaid our 9% loan which had been generating a preferential return to us of about
$18 million per year.
Second, we have continued to deleverage the Company. Given our strong organic growth, we would need
to “leverage up” by about $1 billion per year to remain “leverage neutral.” In the current environment (as
discussed below) we are not able to invest $1 billion with adequate returns to justify additional borrowings.
Third, we have rapidly expanded our development program. Development of self-storage properties is dilutive
in the short term to free cash flow for a couple of reasons. First, a good portion of the cost of personnel and their
related activities involved in this program (about $3 million in 2014) are expensed instead of capitalized into
the cost of the new projects. Second, self-storage properties generally require eight to twelve months to
develop and once opened operate at a loss during the first six to twelve months. They do not achieve their
targeted level of cash flow for two to three years. In addition, development costs must be funded with capital for
which the funding costs are being expensed. We factor this dilution into our development return analysis and
believe our development program will add to our intrinsic value.
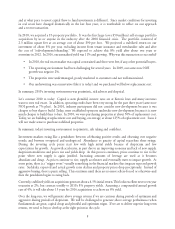
Our free cash flow, dividends, net income and core funds from operations
1
per share continue to grow nicely,
although at different rates in the short term. Long term, as demonstrated in our ten year growth rate, they tend
to converge.
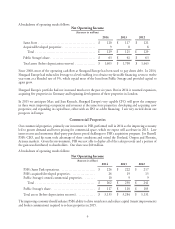
Five-year Ten-year
2014 2009 2004 growth rate growth rate
Free cash flow $ 7.73 $ 4.75 $ 2.77 10% 11%
Dividends $ 5.60 $ 2.20 $ 1.80 21% 12%
Net income $ 5.25 $ 3.47 $ 1.38 9% 14%
Core funds from operations
$ 8.09 $ 5.03 $ 3.11 10% 10%
(1) See accompanying schedule “Supplemental Non-GAAP Disclosures.”