Progressive 2013 Annual Report Download - page 4
Download and view the complete annual report
Please find page 4 of the 2013 Progressive annual report below. You can navigate through the pages in the report by either clicking on the pages listed below, or by using the keyword search tool below to find specific information within the annual report.-
 1
1 -
 2
2 -
 3
3 -
 4
4 -
 5
5 -
 6
6 -
 7
7 -
 8
8 -
 9
9 -
 10
10 -
 11
11 -
 12
12 -
 13
13 -
 14
14 -
 15
15 -
16
-
17
-
18
-
19
-
20
-
21
-
22
-
23
-
24
-
25
-
26
-
27
-
28
-
29
-
30
-
31
-
32
-
33
-
34
-
35
-
36
-
37
-
38
-
39
-
40
-
41
-
42
-
43
-
44
-
45
-
46
-
47
-
48
-
49
-
50
-
51
-
52
-
53
-
54
-
55
-
56
-
57
-
58
-
59
-
60
-
61
-
62
-
63
-
64
-
65
-
66
-
67
-
68
-
69
-
70
-
71
-
72
-
73
-
74
-
75
-
76
-
77
-
78
-
79
-
80
-
81
-
82
-
83
-
84
-
85
-
86
-
87
-
88
-
89
-
90
-
91
-
92
 |
 |

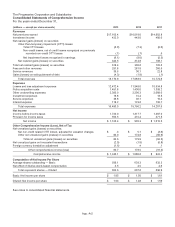
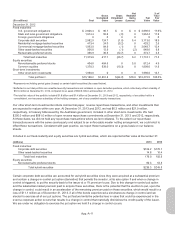
The Progressive Corporation and Subsidiaries
Consolidated Statements of Changes in Shareholders’ Equity
For the years ended December 31,
(millions — except per share amounts) 2013 2012 2011
Common Shares, $1.00 Par Value
Balance, Beginning of year $ 604.6 $ 613.0 $ 662.4
Stock options exercised 0 .1 2.0
Treasury shares purchased1(11.0) (8.6) (51.3)
Net restricted equity awards issued/vested/(forfeited) 2.2 .1 (.1)
Balance, End of year $ 595.8 $ 604.6 $ 613.0
Paid-In Capital
Balance, Beginning of year $1,077.0 $1,006.2 $1,007.1
Stock options exercised 0 .4 20.4
Tax benefit from exercise/vesting of equity-based compensation 10.3 5.8 6.4
Treasury shares purchased1(20.4) (14.5) (80.7)
Net restricted equity awards (issued)/(vested)/forfeited (2.2) (.1) .1
Amortization of equity-based compensation 64.9 62.4 50.3
Reinvested dividends on restricted stock units 12.4 11.2 2.6
Other 0 5.6 0
Balance, End of year $1,142.0 $1,077.0 $1,006.2
Retained Earnings
Balance, Beginning of year $3,454.4 $3,495.0 $3,595.7
Net income 1,165.4 902.3 1,015.5
Treasury shares purchased1(242.0) (151.1) (865.8)
Cash dividends declared on common shares ($1.4929, $1.2845,
and $.4072 per share) (889.2) (772.5) (248.1)
Reinvested dividends on restricted stock units (12.4) (11.2) (2.6)
Other, net 23.8 (8.1) .3
Balance, End of year $3,500.0 $3,454.4 $3,495.0
Accumulated Other Comprehensive Income, Net of Tax
Balance, Beginning of year $ 871.0 $ 692.5 $ 783.7
Other comprehensive income (loss) 80.7 178.5 (91.2)
Balance, End of year $ 951.7 $ 871.0 $ 692.5
Total Shareholders’ Equity $6,189.5 $6,007.0 $5,806.7
1In December 2013, we purchased 4.0 million shares at a price of $25.50 per share in a privately negotiated transaction with the “Peter B. Lewis
Trust under Agreement dated December 21, 1994, as modified.” Mr. Lewis was our non-executive Chairman of the Board until his death in
November 2013.
There are 20.0 million Serial Preferred Shares authorized; no such shares are issued or outstanding.
There are 5.0 million Voting Preference Shares authorized; no such shares have been issued.
See notes to consolidated financial statements.
App.-A-4