Progressive 2013 Annual Report Download - page 12
Download and view the complete annual report
Please find page 12 of the 2013 Progressive annual report below. You can navigate through the pages in the report by either clicking on the pages listed below, or by using the keyword search tool below to find specific information within the annual report.-
 1
1 -
 2
2 -
 3
3 -
 4
4 -
 5
5 -
 6
6 -
 7
7 -
 8
8 -
 9
9 -
 10
10 -
 11
11 -
 12
12 -
 13
13 -
 14
14 -
 15
15 -
 16
16 -
 17
17 -
 18
18 -
 19
19 -
 20
20 -
 21
21 -
 22
22 -
23
-
24
-
25
-
26
-
27
-
28
-
29
-
30
-
31
-
32
-
33
-
34
-
35
-
36
-
37
-
38
-
39
-
40
-
41
-
42
-
43
-
44
-
45
-
46
-
47
-
48
-
49
-
50
-
51
-
52
-
53
-
54
-
55
-
56
-
57
-
58
-
59
-
60
-
61
-
62
-
63
-
64
-
65
-
66
-
67
-
68
-
69
-
70
-
71
-
72
-
73
-
74
-
75
-
76
-
77
-
78
-
79
-
80
-
81
-
82
-
83
-
84
-
85
-
86
-
87
-
88
-
89
-
90
-
91
-
92
 |
 |

The other asset-backed security in the table above represents one hybrid security that was acquired at a deep discount to
par due to a failing auction, and contains a put option that allows the investor to put that security back to the auction at par if
the auction is restored. This embedded derivative has the potential to more than double our initial investment yield.
The hybrid securities in our nonredeemable preferred stock portfolio are perpetual preferred stocks that have call features
with fixed-rate coupons, whereby the change in value of the call features is a component of the overall change in value of
the preferred stocks.
Our securities are reported at fair value, with the changes in fair value of these securities (other than hybrid securities and
derivative instruments) reported as a component of accumulated other comprehensive income, net of deferred income
taxes. The changes in fair value of the hybrid securities and derivative instruments are recorded as a component of net
realized gains (losses) on securities.
At December 31, 2013, bonds and certificates of deposit in the principal amount of $153.2 million were on deposit to meet
state insurance regulatory and/or rating agency requirements. We did not have any securities of any one issuer, excluding
U.S. government obligations, with an aggregate cost or fair value exceeding 10% of total shareholders’ equity at
December 31, 2013 or 2012. At December 31, 2013, we did not have any debt securities that were non-income producing
during the preceding 12 months.
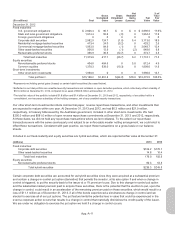
Fixed Maturities The composition of fixed maturities by maturity at December 31, 2013, was:
(millions) Cost Fair Value
Less than one year $ 1,829.3 $ 1,857.6
One to five years 8,554.8 8,693.6
Five to ten years 2,860.5 2,812.1
Ten years or greater 102.6 109.0
Total1$13,347.2 $13,472.3
1Excludes $68.1 million related to our open interest rate swap positions.
Asset-backed securities are classified in the maturity distribution table based upon their projected cash flows. All other
securities which do not have a single maturity date are reported based upon expected average maturity. Contractual
maturities may differ from expected maturities because the issuers of the securities may have the right to call or prepay
obligations.
Gross Unrealized Losses As of December 31, 2013, we had $123.6 million of gross unrealized losses in our fixed-income
securities (i.e., fixed-maturity securities, nonredeemable preferred stocks, and short-term investments) and $2.4 million in
our common equities. We currently do not intend to sell the fixed-income securities and determined that it is more likely than
not that we will not be required to sell these securities for the period of time necessary to recover their cost bases. A review
of our fixed-income securities indicated that the issuers were current with respect to their interest obligations and that there
was no evidence of any deterioration of the current cash flow projections that would indicate we would not receive the
remaining principal at maturity. In addition, 89% of our common stock portfolio was indexed to the Russell 1000; as such,
this portfolio may contain securities in a loss position for an extended period of time, subject to possible write-downs, as
described below. We may retain these securities as long as the portfolio and index correlation remain similar. To the extent
there is issuer-specific deterioration, we may write-down the securities of that issuer. The remaining 11% of our common
stocks are part of a managed equity strategy selected and administered by external investment advisors. If our strategy
were to change and these securities were determined to be other-than-temporarily impaired, we would recognize a
write-down in accordance with our stated policy.
App.-A-12