Progressive 2013 Annual Report Download
Download and view the complete annual report
Please find the complete 2013 Progressive annual report below. You can navigate through the pages in the report by either clicking on the pages listed below, or by using the keyword search tool below to find specific information within the annual report.-
 1
1 -
 2
2 -
 3
3 -
 4
4 -
 5
5 -
 6
6 -
 7
7 -
 8
8 -
 9
9 -
 10
10 -
 11
11 -
 12
12 -
13
-
14
-
15
-
16
-
17
-
18
-
19
-
20
-
21
-
22
-
23
-
24
-
25
-
26
-
27
-
28
-
29
-
30
-
31
-
32
-
33
-
34
-
35
-
36
-
37
-
38
-
39
-
40
-
41
-
42
-
43
-
44
-
45
-
46
-
47
-
48
-
49
-
50
-
51
-
52
-
53
-
54
-
55
-
56
-
57
-
58
-
59
-
60
-
61
-
62
-
63
-
64
-
65
-
66
-
67
-
68
-
69
-
70
-
71
-
72
-
73
-
74
-
75
-
76
-
77
-
78
-
79
-
80
-
81
-
82
-
83
-
84
-
85
-
86
-
87
-
88
-
89
-
90
-
91
-
92
 |
 |

The Progressive Corporation
2013
Annual Report to
Shareholders
Table of contents
-
Page 1
The Progressive Corporation 2013 Annual Report to Shareholders -
Page 2
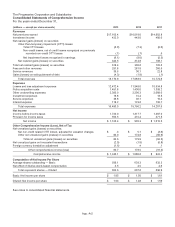
... - except per share amounts) 2013 2012 2011 Revenues Net premiums earned Investment income Net realized gains (losses) on securities: Other-than-temporary impairment (OTTI) losses: Total OTTI losses Non-credit losses, net of credit losses recognized on previously recorded non-credit OTTI losses Net... -
Page 3
The Progressive Corporation and Subsidiaries Consolidated Balance Sheets December 31, (millions) 2013 2012 Assets Investments - Available-for-sale, at fair value: Fixed maturities (amortized cost: $13,415.3 and $11,373.9) Equity securities: Nonredeemable preferred stocks (cost: $445.7 and $404.0) ... -
Page 4
The Progressive Corporation and Subsidiaries Consolidated Statements of Changes in Shareholders' Equity For the years ended December 31, (millions - except per share amounts) 2013 2012 2011 Common Shares, $1.00 Par Value Balance, Beginning of year Stock options exercised Treasury shares purchased1 ... -
Page 5
... cash provided by operating activities: Depreciation Amortization of fixed-income securities Amortization of equity-based compensation Net realized (gains) losses on securities Net (gains) losses on disposition of property and equipment (Gains) losses on extinguishment of debt Changes in: Premiums... -
Page 6
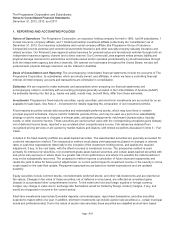
..., 2013. Our insurance subsidiaries and mutual company affiliate (the Progressive Group of Insurance Companies) provide personal and commercial automobile insurance and other specialty property-casualty insurance and related services. Our Personal Lines segment writes insurance for personal autos and... -
Page 7
... financial condition, business prospects, or other factors, (ii) market-related factors, such as interest rates or equity market declines, or (iii) credit-related losses, where the present value of cash flows expected to be collected are lower than the amortized cost basis of the security. App.-A-7 -
Page 8
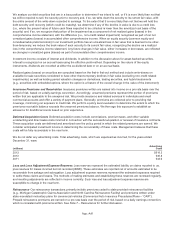
... are applicable to the unexpired risk. We provide insurance and related services to individuals and small commercial accounts and offer a variety of payment plans. Generally, premiums are collected prior to providing risk coverage, minimizing our exposure to credit risk. We perform a policy level... -
Page 9
... which primarily relates to capitalized software projects, for the years ended December 31, was: (millions) Capitalized Interest 2013 2012 2011 $.8 .3 .4 Guaranty Fund Assessments We are subject to state guaranty fund assessments, which provide for the payment of covered claims or other insurance... -
Page 10
...the years ended December 31, was: (millions) 2013 2012 2011 Pretax expense Tax benefit $64.9 22.7 $63.4 22.2 $50.5 17.7 Net Income Per Share Basic net income per share is computed using the weighted average number of common shares outstanding during the reporting period, excluding unvested time... -
Page 11
... at December 31, 2013, compared to an asset of $90.9 million at December 31, 2012. total fair value of the portfolio included $1.8 billion and $1.4 billion at December 31, 2013 and 2012, respectively, of securities held in a consolidated, non-insurance subsidiary of the holding company, net of any... -
Page 12
...were on deposit to meet state insurance regulatory and/or rating agency requirements. We did not have any securities of any one issuer, excluding U.S. government obligations, with an aggregate cost or fair value exceeding 10% of total shareholders' equity at December 31, 2013 or 2012. At December 31... -
Page 13
... in the equity market values in 2013 and losses recognized in net income as a result of our other-than-temporary impairment review process. We had no material decreases in valuation as a result of credit rating downgrades on our fixed-maturity securities during 2013. Unrealized losses on our... -
Page 14
...December 31, 2013, 2012, and 2011, respectively, received in excess of the cash flows expected to be collected at the time of the write-downs. reductions of prior credit impairments where the current credit impairment requires writing securities down to fair value (i.e., no remaining non-credit loss... -
Page 15
... (i.e., expected recovery value) was calculated using the current book yield for each security, and was compared to its current amortized value. In the event that the net present value was below the amortized value, a credit loss was deemed to exist, and the security was written down. App.-A-15 -
Page 16
...(losses) for the years ended December 31, were: (millions) 2013 2012 2011 Gross realized gains on security sales Fixed maturities: U.S. government obligations State and local government obligations Corporate and other debt securities Residential mortgage-backed securities Commercial mortgage-backed... -
Page 17
... sales transactions in our fixed-income portfolio, related to movements in credit spreads and interest rates, rebalancing of our equity-indexed portfolio, and tax management strategies. In addition, gains and losses reflect recoveries from litigation settlements and holding period valuation changes... -
Page 18
... our historical presentation. NA = Not Applicable CASH FLOW HEDGES During the years ended December 31, 2013, 2012, and 2011, we repurchased, in the open market, $54.1 million, $30.9 million, and $15.0 million, respectively, in aggregate principal amount of our 6.70% Fixed-to-Floating Rate Junior... -
Page 19
... 31, 2013, 2012, and 2011, we invested in interest rate swap positions primarily to manage the fixed-income portfolio duration. During 2013, we opened three 10-year interest rate swap positions with a total notional value of $750 million. In each case, we are paying a fixed rate and receiving... -
Page 20
... market. Based on this evaluation, we concluded that there was sufficient activity related to the sectors and securities for which we obtained valuations. The composition of the investment portfolio by major security type was: Fair Value Level 2 Level 3 (millions) December 31, 2013 Level 1 Total... -
Page 21
... of discount or premium, since that value very closely approximates what an active market participant would be willing to pay for such securities. The remainder of our short-term securities are classified as Level 2 and are not priced externally since these securities continually trade at par value... -
Page 22
... prepayment rates and current prepayment assumptions and cash flow estimates. We further stratify each class of our structured debt securities into more finite sectors (e.g., planned amortization class, first pay, second pay, senior, subordinated, etc.) and use duration, credit quality, and... -
Page 23
... each major sector adjusting for duration and credit quality differences to better understand our portfolio's results. Additionally, we review on a monthly basis our external sales transactions and compare the actual final market sales price to a previous market valuation price. This review provides... -
Page 24
...Level 3 Fair Value Fair Value Calls/ Net Realized Net Fair Value at Dec. 31, Maturities/ (Gain)/Loss Change in Transfers at Dec. 31, 2012 Paydowns Purchases Sales on Sales Valuation In (Out)1 2013 (millions) Fixed maturities: Asset-backed securities: Residential mortgage-backed Commercial mortgage... -
Page 25
...: Quantitative Information about Level 3 Fair Value Measurements Fair Value Unobservable at Dec. 31, Valuation Unobservable Input 2013 Technique Input Assumption ($ in millions) Fixed maturities: Asset-backed securities: Residential mortgage-backed Commercial mortgage-backed Total fixed maturities... -
Page 26
... Progressive Corporation. Debt includes amounts we have borrowed and contributed to the capital of our insurance subsidiaries or used, or have available for use, for other business purposes. Fair values are obtained from external sources. There are no restrictive financial covenants or credit rating... -
Page 27
... 31, 2013, were as follows: (millions) Year Payments 2014 2015 2016 2017 2018 Thereafter Total $ 0 0 0 0 0 1,877.1 $1,877.1 5. INCOME TAXES The components of our income tax provision were as follows: (millions) 2013 2012 2011 Current tax provision Deferred tax expense (benefit) Total income... -
Page 28
...related interest and penalties, as of December 31, 2013 and 2012. For the year ended December 31, 2013, $0.2 million of interest benefit has been recorded in the tax provision. For the years ended December 31, 2012 and 2011, no interest expense or benefit has been recorded in the tax provision. App... -
Page 29
... on case reserves was the primary contributor to the favorable development in our Direct auto business. In our Commercial Lines business, we experienced unfavorable development due to higher frequency and severity on late emerging claims primarily in our bodily injury coverage for our truck business... -
Page 30
... PIP coverage and an increase in our estimate of bodily injury severity for accident year 2011. Unfavorable development in our Commercial Lines business reflects higher than anticipated frequency and severity costs on late emerging claims and higher settlements on large losses. 2011 • • About... -
Page 31
... subsidiaries could pay aggregate dividends of $1,169.7 million in 2014 without prior approval from regulatory authorities, provided the dividend payments are not made within 12 months of previous dividends paid by the applicable subsidiary. 9. EMPLOYEE BENEFIT PLANS Retirement Plans Progressive has... -
Page 32
... incentive plans (cash) and equity incentive plans. Cash incentive compensation includes a cash bonus program for a limited number of senior executives and our Gainsharing program for other employees; the structures of these programs are similar in nature. Equity incentive compensation plans provide... -
Page 33
...11.28 $ $ 0 0 The total pretax intrinsic value of options exercised during the year ended December 31, 2011, was $15.2 million, based on the actual stock price at the time of exercise. Incentive Compensation Plans - Directors Our 2003 Directors Equity Incentive Plan, which provides for the granting... -
Page 34
... on the market value of the awards at the time of grant. A summary of all directors' restricted stock activity during the years ended December 31, follows: 2013 Weighted Average Grant Number of Date Fair Shares Value 2012 Weighted Average Grant Number of Date Fair Shares Value 2011 Weighted Average... -
Page 35
..., and national agencies). The Direct business includes business written directly by us online, by phone, or on mobile devices. We also sell personal auto physical damage insurance via the Internet in Australia. For the years ended December 31, 2013, 2012, and 2011, net premiums earned on our... -
Page 36
... for 91% of the total Personal Lines segment net premiums earned in 2013, 2012, and 2011; insurance for our special lines products (e.g., motorcycles, ATVs, RVs, mobile homes, watercraft, and snowmobiles) accounted for the balance of the Personal Lines net premiums earned. profit (loss) for fees and... -
Page 37
... accumulated other Total tax other comprehensive (provision) comprehensive income benefit income Balance at December 31, 2012 Other comprehensive income (loss) before reclassifications: Investment securities Net non-credit related OTTI losses, adjusted for valuation changes Forecasted transactions... -
Page 38
...securities Net non-credit related OTTI losses, adjusted for valuation changes Forecasted transactions Foreign currency translation adjustment Total other comprehensive income (loss) before reclassifications Less: Reclassification adjustment for amounts realized in net income by income statement line... -
Page 39
.... We consider all legal actions relating to such claims in establishing our loss and loss adjustment expense reserves. In addition, The Progressive Corporation and/or its insurance subsidiaries are named as defendants in a number of class action or individual lawsuits arising out of the operations... -
Page 40
... cell phone calls to insureds. One putative class action lawsuit alleging that Progressive fails to secure new waivers of stacking forms when additional vehicles are added to an auto or motorcycle policy and fails to make payment of stacked underinsured motorist benefits in an amount which is fair... -
Page 41
... a preferred provider discount to medical payment claims. This case was accrued for and settled in 2013. One putative class action lawsuit challenging the manner in which Progressive charges premium and assesses total loss claims for commercial vehicle stated amount policies. This case was accrued... -
Page 42
... annual cash bonus program currently in place for our employees (our "Gainsharing program"). Although recalibrated every year, the structure of the Gainsharing program generally remains the same. For 2013, the Gainshare factor was 1.21, compared to 1.12 in 2012 and 1.10 in 2011. Our annual dividend... -
Page 43
..., changes in shareholders' equity and cash flows, present fairly, in all material respects, the financial position of The Progressive Corporation and its subsidiaries at December 31, 2013 and December 31, 2012, and the results of their operations and their cash flows for each of the three years in... -
Page 44
... control structure was designed under the supervision of our Chief Executive Officer and Chief Financial Officer to provide reasonable assurance regarding the reliability of financial reporting and the preparation of financial statements for external purposes in accordance with accounting principles... -
Page 45
... 1937 and are estimated to be the country's fourth largest private passenger auto insurer based on net premiums written during 2013. Our insurance companies offer personal and commercial automobile insurance and other specialty property-casualty insurance and related services throughout the United... -
Page 46
... country primarily during the first six months of 2013. Total catastrophe losses for 2013 were 0.7 points less than 2012. We also realized $45.1 million, or 0.3 combined ratio points, of unfavorable prior accident year reserve development, compared to 0.1 points of unfavorable development last year... -
Page 47
... 2013, on a year-over-year basis, our written premium per policy for our Agency and Direct auto businesses increased 5% and 3%, respectively, primarily reflecting rate increases taken in 2012. Written premium per policy for our special lines products increased 3%, compared to last year. Commercial... -
Page 48
... capital to support all of the insurance we can profitably write and service. After taking into account the dividends and security purchases discussed above, we ended 2013 with a total capital position of $8.1 billion. II. FINANCIAL CONDITION A. Holding Company In 2013, The Progressive Corporation... -
Page 49
... years. B. Liquidity and Capital Resources Progressive's insurance operations create liquidity by collecting and investing premiums from new and renewal business in advance of paying claims. As an auto insurer, our claims liabilities are generally short in duration. Generally, at any point in time... -
Page 50
... and provides maximum flexibility to repurchase stock or other securities, consider acquisitions, and pay dividends to shareholders, among other purposes. This capital is largely held at a non-insurance subsidiary of the holding company. • • At all times during the last two years, our total... -
Page 51
... country, that are designed to provide end-to-end resolution for auto physical damage losses. Currently, we own approximately 80% of our Service Centers and lease the remaining sites. In 30 of these centers, we have combined a claims office with a Service Center to improve our efficiency and manage... -
Page 52
...) 2013 2012 2011 NET PREMIUMS WRITTEN Personal Lines Agency Direct Total Personal Lines Commercial Lines Other indemnity Total underwriting operations Growth over prior year NET PREMIUMS EARNED Personal Lines Agency Direct Total Personal Lines Commercial Lines Other indemnity Total underwriting... -
Page 53
... review new policies, rate levels, and the retention characteristics of our books of business. The following table shows our year-over-year changes in new and renewal applications (i.e., issued policies): Growth Over Prior Year 2013 2012 2011 APPLICATIONS Personal Lines New Renewal Commercial Lines... -
Page 54
...better loss experience, and represent a sizable segment of the market. More and more of our customers, especially direct customers, are now multi-product customers with combinations of auto, special lines, home or renters coverage. During 2012 and 2013, our key provider for PHA in the Agency channel... -
Page 55
...three years ended December 31, our underwriting profitability results were as follows: 2013 Underwriting Profit (Loss) $ Margin 2012 Underwriting Profit (Loss) $ Margin 2011 Underwriting Profit (Loss) $ Margin ($ in millions) Personal Lines Agency Direct Total Personal Lines Commercial Lines Other... -
Page 56
... Commercial Lines business, and our underwriting operations in total, as defined in Note 10 - Segment Information, were as follows: Underwriting Performance1 2013 2012 2011 Personal Lines - Agency Loss & loss adjustment expense ratio Underwriting expense ratio Combined ratio Personal Lines - Direct... -
Page 57
... breakage. Total personal auto incurred severity (i.e., average cost per claim, including both paid losses and the change in reserves) was up about 2.5%, 5.0%, and 0.5% in 2013, 2012, and 2011, respectively, over the prior-year periods. • 2013 - Severity for our collision coverage increased about... -
Page 58
... on case reserves was the primary contributor to the favorable development in our Direct auto business. In our Commercial Lines business, we experienced unfavorable development due to higher frequency and severity on late emerging claims primarily in our bodily injury coverage for our truck business... -
Page 59
... Prior Year 2013 2012 2011 Net premiums written Net premiums earned Policies in force 6% 7% 3% 8% 7% 4% 5% 5% 5% Progressive's Personal Lines business writes insurance for personal autos and recreational vehicles and represented 90% of our total net premiums written for both 2013 and 2011 and... -
Page 60
..., we report our Agency and Direct business results separately as components of our Personal Lines segment to provide further understanding of our products by channel. The Agency Business Growth Over Prior Year 2013 2012 2011 Net premiums written Net premiums earned Auto: policies in force new... -
Page 61
... other auto-related insurance for automobiles and trucks owned and/or operated predominantly by small businesses, with the majority of our customers insuring two or fewer vehicles. Our Commercial Lines business represented 10% of our total net premiums written in both 2013 and 2011 and 11% in 2012... -
Page 62
... base and products written, both businesses require the same fundamental skills, including disciplined underwriting and pricing, as well as excellent claims service. Since the Commercial Lines policies have higher limits than Personal Lines auto, we analyze Commercial Lines' large loss trends and... -
Page 63
... rejection forms; labor rates paid to auto body repair shops; employment related practices, including federal wage and hour claims; alleged patent infringement; and cases challenging other aspects of our claims or marketing practices or other business operations. Other insurance companies face many... -
Page 64
... gains (losses) on certain hybrid securities. ratings at December 31, 2013 and 2012. Credit quality ratings are assigned by nationally recognized securities rating organizations. To calculate the weighted average credit quality ratings, we weight individual securities based on fair value and assign... -
Page 65
... debt securities. NAIC ratings are based on a model that considers the book price of our securities when assessing the probability of future losses in assigning a credit rating. As a result, NAIC ratings can vary from credit ratings issued by NRSROs. Management believes NAIC ratings more accurately... -
Page 66
... in interest rates) between 1.5 and 5 years. Interest rate risk includes the change in value resulting from movements in the underlying market rates of debt securities held. The duration of the fixed-income portfolio was 2.0 years at December 31, 2013, compared to 1.9 years at December 31, 2012. The... -
Page 67
... similarly limited to receiving a below market level coupon for the credit risk premium portion of a similar security as the benchmark variable interest rate adjusts for changes in short-term interest rate levels. Since the beginning of 2011, eleven securities that converted from a fixed-rate coupon... -
Page 68
...31: Fair Value Net Unrealized Gains (Losses) % of AssetBacked Securities Duration (years) Rating (at period end) ($ in millions) 2013 Residential mortgage-backed securities: Prime collateralized mortgage obligations Alt-A collateralized mortgage obligations Collateralized mortgage obligations Home... -
Page 69
... December 31, 2013, we recorded $0.1 million in credit loss write-downs on our CMO portfolio due to estimated principal losses in a security's most recent cash flow projections; we had no write-downs on Alt-A securities. During the years ended December 31, 2012 and 2011, we recorded $0.8 million and... -
Page 70
...2013 and 2012, respectively. During the years ended December 31, 2013, 2012, and 2011, we did not record any write-downs on our municipal portfolio. The following table details the credit quality rating of our municipal securities at December 31, 2013, without the benefit of credit or bond insurance... -
Page 71
... supported by individual mortgages held by the state housing finance agencies, the overall credit quality rating was AA+. Most of these mortgages were supported by FHA, VA, or private mortgage insurance providers. Approximately 5%, or $108.5 million, of our total municipal securities were insured... -
Page 72
...2013, the fair value of the actively managed portfolio was $285.4 million, compared to a cost basis of $224.7 million. We recorded $5.5 million in write-downs on our common equities during 2013, compared to $6.3 million during 2012 and $1.6 million during 2011. Other risk investments include private... -
Page 73
... primarily to manage the fixed-income portfolio duration. The $750 million notional value swaps open in 2013 reflected a gain for the year, as interest rates have risen since the inception of the trades. The losses on the $1,263 million notional value swaps during 2013, 2012, and 2011 and the loss... -
Page 74
... primarily to manage the fixed-income portfolio credit risk. The following table summarizes our corporate credit default swap activity: Net Realized Gains (Losses) Years ended December 31, 2013 2012 2011 (millions) Term Date Effective Maturity Bought or Sold Protection Notional Value 2013 2012... -
Page 75
... in fair value. The write-down activity recorded in the comprehensive income statements for the years ended December 31, was as follows: Write-downs on Securities Sold Write-downs on Securities Held at Period End (millions) Total Write-downs 2013 Residential mortgage-backed securities Commercial... -
Page 76
... available in the market. Our exposure to credit risk is limited due to the nature of the collateral (i.e., U.S. Treasury Notes) received. The income generated on these transactions is calculated at the then applicable general collateral rates on the value of U.S. Treasury securities received. We... -
Page 77
...subsegment level provides us more meaningful estimates of our aggregate loss reserves. In analyzing the ultimate accident year loss experience, our actuarial staff reviews in detail, at the subset level, frequency (number of losses per earned car year), severity (dollars of loss per each claim), and... -
Page 78
... commercial auto physical damage claims and our non-auto lines of business; no change in estimates is presented due to the immaterial level of these reserves. Note: Every percentage point change in our estimate of severity for the 2013, 2012, and 2011 accident years would affect our personal auto... -
Page 79
... through 2012. The last line in the triangle for each year represents the following: Re-estimated reserves = Total amount paid to-date + Re-estimated liability for unpaid losses and LAE-net Changes in the estimated severity and the actual number of late reported claims are the cause of the change in... -
Page 80
... rates or equity market declines (e.g., negative return at either a sector index level or at the broader market level); or (iii) credit-related losses, where the present value of cash flows expected to be collected is lower than the amortized cost basis of the security. Fixed-income securities... -
Page 81
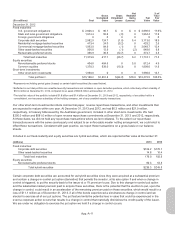
..., uncertainties related to estimates, assumptions, and projections generally; inflation and changes in economic conditions (including changes in interest rates and financial markets); the possible failure of one or more governmental, corporate, or other entities to make scheduled debt payments or... -
Page 82
... ratios, policies in force, per share amounts, and number of people employed) 2013 2012 2011 2010 2009 Net premiums written Growth Net premiums earned Growth Policies in force (thousands): Personal Lines Growth Commercial Lines Growth Total revenues Underwriting margins:1 Personal Lines Commercial... -
Page 83
... income Debt to total capital Price to earnings Price to book Earnings to fixed charges Net premiums written to statutory surplus Statutory combined ratio Dividends declared per share3 Number of people employed NA = Not applicable due to the net loss reported for 2008. 3 Progressive $13,604.3 $13... -
Page 84
... system. Progressive's common shares are listed on the New York Stock Exchange under the symbol PGR. sum may not equal the total because the average equivalent shares differ in the quarterly and annual periods. annual rate of return, assuming dividend reinvestment. 2 The 3 Represents 4 Progressive... -
Page 85
... at the close of trading on December 31, 2008) 2009 2010 2011 2012 2013 PGR S&P Index P/C Group *Assumes reinvestment of dividends Source: Value Line Publishing LLC $121.47 126.46 123.14 $142.00 145.51 148.66 $142.23 148.58 159.49 $164.29 172.35 191.23 $215.01 228.18 257.92 App.-A-85 -
Page 86
... Insurance Companies is primarily an insurer of automobiles and recreational vehicles owned by individuals, and cars and trucks owned and/or operated predominantly by small businesses. As such, our claims liabilities are generally short in duration. Since our incurred losses consist of both payments... -
Page 87
...% 70% 60% 50% 40% 0 Counts 4 Dollars 8 12 16 Quarters Note: The above graphs are presented for our personal auto products on an accident period basis and are based on three years of actual experience for physical damage and nine years for bodily injury and total personal auto. App.-A-87 -
Page 88
... of changes in fair value due to selected hypothetical movements in market rates. Bonds and preferred stocks are individually priced to yield to the worst case scenario, which includes any issuer-specific features, such as a call option. Asset-backed securities and state and local government housing... -
Page 89
...Progressive Corporation and Subsidiaries Net Premiums Written by State (unaudited) ($ in millions) 2013 2012 2011 2010 2009 Florida Texas California New York Georgia Ohio New Jersey Pennsylvania Louisiana Michigan All other Total....9 11.9% 8.8 6.8 5.0 4.9 4.5 2.9 4.1 3.0 3.2 44.9 100.0% App.-A-89 -
Page 90
... Reporting, and Customer Service Personal autos, motorcycles, and recreational vehicles Commercial autos/trucks To receive a quote To report a claim For customer service: If you bought your policy through an independent agent or broker If you bought your policy directly through Progressive online... -
Page 91
... have questions or changes to your account and your Progressive shares are registered in your name, write to: American Stock Transfer & Trust Company, Attn: Operations Center, 6201 15th Avenue, Brooklyn, NY 11219; phone: 1-866-709-7695; email: [email protected]; or visit their website at: amstock.com... -
Page 92
... Commercial Lines Group President M. Jeffrey Charney Chief Marketing Officer William M. Cody Chief Investment Officer Susan Patricia Griffith Claims Group President Valerie Krasowski Chief Human Resource Officer John P. Sauerland Personal Lines Group President Raymond M. Voelker Chief Information...