Pioneer 2014 Annual Report Download - page 7
Download and view the complete annual report
Please find page 7 of the 2014 Pioneer annual report below. You can navigate through the pages in the report by either clicking on the pages listed below, or by using the keyword search tool below to find specific information within the annual report.-
 1
1 -
 2
2 -
 3
3 -
 4
4 -
 5
5 -
 6
6 -
 7
7 -
 8
8 -
 9
9 -
 10
10 -
 11
11 -
 12
12 -
 13
13 -
 14
14 -
 15
15 -
 16
16 -
 17
17 -
 18
18 -
19
-
20
-
21
-
22
-
23
-
24
-
25
-
26
-
27
-
28
-
29
-
30
-
31
-
32
-
33
-
34
-
35
-
36
-
37
-
38
-
39
-
40
-
41
-
42
-
43
-
44
-
45
-
46
-
47
-
48
-
49
-
50
-
51
-
52
-
53
-
54
-
55
-
56
-
57
-
58
-
59
-
60
 |
 |

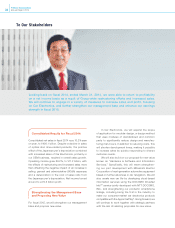
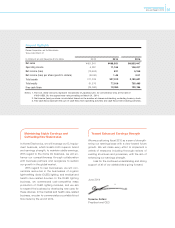
Toward Enhanced Earnings Strength
We are positioning fiscal 2015 as a year of strength-
ening our earnings base with a view toward future
growth. We will make every effort to implement a
variety of measures including thorough reviews of
existing structures and processes, with the aim of
enhancing our earnings strength.
I ask for the continued understanding and strong
support of all of our stakeholders going forward.
June 2014
Susumu Kotani
President and CEO
Maintaining Stable Earnings and
Cultivating New Businesses
In Home Electronics, we will leverage our DJ equip-
ment business, which boasts both superior brand
and earnings strength, to maintain stable earnings.
With regard to the home AV business, we will en-
hance our competitiveness through collaboration
with business partners and reorganize to sustain
our growth in the global market.
With regard to new businesses, we will con-
centrate resources in the businesses of organic
light-emitting diode (OLED) lighting, and medical and
health care-related devices. In the OLED lighting
business, we commenced cost-competitive mass
production of OLED lighting modules, and we aim
to expand the business by developing new uses for
these devices. In the medical and health care-related
business, we plan to commercialize a portable blood
flow meter by the end of 2014.
Financial Highlights
Pioneer Corporation and Its Subsidiaries
Years ended March 31
In millions of yen and thousands of U.S. dollars 2013 2014 2014
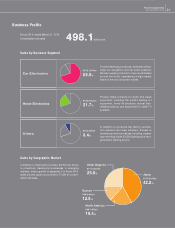
Net sales ¥451,841 ¥498,051 $4,835,447
Operating income 5,997 11,169 108,437
Net income (loss) (19,552) 531 5,155
Net income (loss) per share (yen/U.S. dollars) (60.90) 1.49 0.01
Total assets 311,325 327,913 3,183,621
Total equity 81,576 77,816 755,495
Free cash flows (34,060) 12,380 120,194
Notes: 1. The U.S. dollar amounts represent translations of Japanese yen, for convenience only, at the rate of
¥103=US$1.00, the approximate rate prevailing on March 31, 2014.
2. Net income (loss) per share is calculated based on the number of shares outstanding, excluding treasury stock.
3. Free cash ows represent the sum of cash ows from operating activities and cash ows from investing activities.
05
Pioneer Corporation
Annual Report 2014