Pioneer 2007 Annual Report Download - page 9
Download and view the complete annual report
Please find page 9 of the 2007 Pioneer annual report below. You can navigate through the pages in the report by either clicking on the pages listed below, or by using the keyword search tool below to find specific information within the annual report.-
 1
1 -
 2
2 -
 3
3 -
 4
4 -
 5
5 -
 6
6 -
 7
7 -
 8
8 -
 9
9 -
 10
10 -
 11
11 -
 12
12 -
 13
13 -
 14
14 -
 15
15 -
 16
16 -
 17
17 -
 18
18 -
 19
19 -
 20
20 -
21
-
22
-
23
-
24
-
25
-
26
-
27
-
28
-
29
-
30
-
31
-
32
-
33
-
34
-
35
-
36
-
37
-
38
-
39
-
40
-
41
-
42
-
43
-
44
-
45
-
46
-
47
-
48
-
49
-
50
-
51
-
52
-
53
-
54
-
55
-
56
-
57
-
58
-
59
-
60
-
61
-
62
-
63
-
64
-
65
-
66
-
67
-
68
-
69
-
70
-
71
-
72
-
73
-
74
 |
 |

Annual Report 2007 8
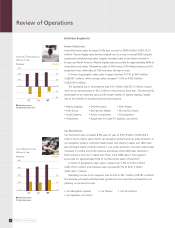
Patent Licensing
In Patent Licensing, royalty revenue decreased 45.4% year on year to ¥4.7 billion
(US$39.5 million). This decrease was attributable to the impact of the expiration of
some patents licensed to the optical disc industry.
Operating income in this segment declined 45.6% to ¥3.9 billion (US$33.3 million).
• Licensing of Patents Related to Laser Optical Disc Technologies
Others
In the Others segment, sales rose 7.8% year on year to ¥66.0 billion (US$559.4
million). This mainly reflected higher sales of factory automation systems and passive-
matrix organic light-emitting diode (OLED) displays, despite lower sales of speaker
units for cellular phones.
In terms of geographic sales, sales in Japan increased 24.9% to ¥41.5 billion
(US$351.6 million), while overseas sales were down 12.4% at ¥24.5 billion
(US$207.8 million).
Operating income in this segment was ¥2.9 billion (US$24.4 million) compared
with an operating loss of ¥4.0 billion in the previous fiscal year. This improvement
was mainly attributable to improved profitability in OLED displays primarily due to the
benefits of business restructuring measures.
• Organic Light-Emitting Diode (OLED) Displays • Factory Automation Systems
• Speaker Units • Electronics Devices and Parts
• Business-use AV Systems, and others
Notes: 1. Operating income (loss) is presented as operating revenue less cost of sales and selling, general and
administrative expenses, in accordance with accounting practices generally accepted in Japan.
2. Operating income (loss) in each business segment represents operating income (loss) before
elimination of intersegment transactions.
Operating Revenue by Geographic Markets
Patent Licensing
(Billions of Yen)
Revenue Income
Others
(Billions of Yen)
Revenue Income
Japan
(Billions of Yen)
North America
(Billions of Yen)
Europe
(Billions of Yen)
Other Regions
(Billions of Yen)
0
5
10
15
’07’06’05
0
5
10
’07’06’05
0
40
80
–5
0
5
’07’06’05
0
50
100
150
200
250
’07’06’05
0
50
100
150
200
250
’07’06’05
0
50
100
150
200
250
’07’06’05
0
50
100
150
200
250
■ Operating revenue
■ Operating income
■ Operating revenue
■ Operating income (loss)
Note: Operating revenue by geographic market represents revenue based on the geographic location of each unaffiliated customer.