Pioneer 2007 Annual Report Download - page 3
Download and view the complete annual report
Please find page 3 of the 2007 Pioneer annual report below. You can navigate through the pages in the report by either clicking on the pages listed below, or by using the keyword search tool below to find specific information within the annual report.-
 1
1 -
 2
2 -
 3
3 -
 4
4 -
 5
5 -
 6
6 -
 7
7 -
 8
8 -
 9
9 -
 10
10 -
 11
11 -
 12
12 -
 13
13 -
 14
14 -
15
-
16
-
17
-
18
-
19
-
20
-
21
-
22
-
23
-
24
-
25
-
26
-
27
-
28
-
29
-
30
-
31
-
32
-
33
-
34
-
35
-
36
-
37
-
38
-
39
-
40
-
41
-
42
-
43
-
44
-
45
-
46
-
47
-
48
-
49
-
50
-
51
-
52
-
53
-
54
-
55
-
56
-
57
-
58
-
59
-
60
-
61
-
62
-
63
-
64
-
65
-
66
-
67
-
68
-
69
-
70
-
71
-
72
-
73
-
74
 |
 |

Annual Report 2007 2
In millions of yen and thousands of U.S. dollars, except per share information
Yen % change U.S. Dollars
2005 2006 2007 2007/2006 2007
Operating revenue ¥711,042 ¥754,964 ¥797,102 +5.6% $6,755,102
Operating income (loss) 691 (16,409) 12,487 105,822
Loss from continuing operations (10,112) (85,758) (9,536) (80,814)
Net loss (8,789) (84,986) (6,761) (57,297)
Per share of common stock:
Loss from continuing operations (57.65) (491.66) (54.67) (0.46)
Net loss (50.11) (487.23) (38.76) (0.33)
Cash dividends 25.00 10.00 10.00 0.08
Cash flows from operating activities 19,946 68,329 16,752 141,966
Cash flows from investing activities (93,516) (29,759) (16,468) (139,559)
Cash flows from financing activities (4,019) (38,551) (21,673) (183,669)
Total assets 725,167 678,046 635,474 5,385,373
Shareholders’ equity 332,239 273,250 268,116 2,272,170
Notes: 1. The U.S. dollar amounts in this report represent translation of Japanese yen, for convenience only, at the rate of ¥118=U.S.$1.00 at March 31, 2007.
2. Operating income (loss) in this report is presented as operating revenue less cost of sales and selling, general and administrative expenses in accordance
with accounting practices generally accepted in Japan.
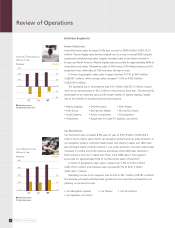
Financial Highlights
Pioneer Corporation and Subsidiaries
Years ended March 31
Operating Revenue
(Billions of Yen)
Income (Loss)
(Billions of Yen)
■ Operating income (loss)
■ Net income (loss)
Cash Flows
(Billions of Yen)
■ Cash flows from operating activities
■ Cash flows from investing activities
●Free cash flows (Cash flows from operating activities +
Cash flows from investing activities)
‘06‘05 ‘07‘04‘03
0
250
500
750
1,000
‘06‘05 ‘07‘04‘03
–100
–80
–60
–40
–20
0
20
40
60
–100
–50
0
50
100
‘06‘05 ‘07‘04‘03