Pfizer 2012 Annual Report Download - page 54
Download and view the complete annual report
Please find page 54 of the 2012 Pfizer annual report below. You can navigate through the pages in the report by either clicking on the pages listed below, or by using the keyword search tool below to find specific information within the annual report.-
 1
1 -
2
-
3
-
4
-
5
-
6
-
7
-
8
-
9
-
10
-
11
-
12
-
13
-
14
-
15
-
16
-
17
-
18
-
19
-
20
-
21
-
22
-
23
-
24
-
25
-
26
-
27
-
28
-
29
-
30
-
31
-
32
-
33
-
34
-
35
-
36
-
37
-
38
-
39
-
40
-
41
-
42
-
43
-
 44
44 -
 45
45 -
 46
46 -
 47
47 -
 48
48 -
 49
49 -
 50
50 -
 51
51 -
 52
52 -
 53
53 -
 54
54 -
 55
55 -
 56
56 -
 57
57 -
 58
58 -
 59
59 -
 60
60 -
 61
61 -
 62
62 -
 63
63 -
 64
64 -
65
-
66
-
67
-
68
-
69
-
70
-
71
-
72
-
73
-
74
-
75
-
76
-
77
-
78
-
79
-
80
-
81
-
82
-
83
-
84
-
85
-
86
-
87
-
88
-
89
-
90
-
91
-
92
-
93
-
94
-
95
-
96
-
97
-
98
-
99
-
100
-
101
-
102
-
103
-
104
-
105
-
106
-
107
-
108
-
109
-
110
-
111
-
112
-
113
-
114
-
115
-
116
-
117
-
118
-
119
-
120
-
121
 |
 |

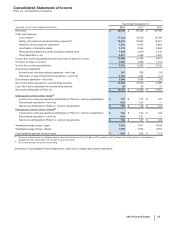
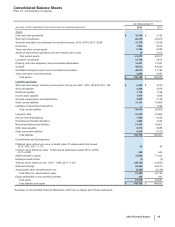
Consolidated Statements of Income
Pfizer Inc. and Subsidiary Companies
2012 Financial Report
53
Year Ended December 31,
(MILLIONS, EXCEPT PER COMMON SHARE DATA) 2012 2011 2010
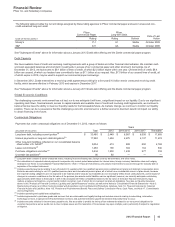
Revenues $58,986 $65,259 $65,165
Costs and expenses:
Cost of sales(a) 11,334 14,076 14,788
Selling, informational and administrative expenses(a) 16,616 18,832 18,973
Research and development expenses(a) 7,870 9,074 9,483
Amortization of intangible assets 5,175 5,544 5,364
Restructuring charges and certain acquisition-related costs 1,880 2,930 3,145
Other deductions––net 4,031 2,499 3,941
Income from continuing operations before provision for taxes on income 12,080 12,304 9,471
Provision for taxes on income 2,562 3,909 1,153
Income from continuing operations 9,518 8,395 8,318
Discontinued operations:
Income/(loss) from discontinued operations––net of tax 297 350 (19)
Gain/(loss) on sale of discontinued operations––net of tax 4,783 1,304 (11)
Discontinued operations––net of tax 5,080 1,654 (30)
Net income before allocation to noncontrolling interests 14,598 10,049 8,288
Less: Net income attributable to noncontrolling interests 28 40 31
Net income attributable to Pfizer Inc. $14,570 $10,009 $8,257
Earnings per common share––basic(b)
Income from continuing operations attributable to Pfizer Inc. common shareholders $1.27 $1.07 $1.03
Discontinued operations––net of tax 0.68 0.21 —
Net income attributable to Pfizer Inc. common shareholders $1.96 $1.28 $1.03
Earnings per common share––diluted(b)
Income from continuing operations attributable to Pfizer Inc. common shareholders $1.26 $1.06 $1.03
Discontinued operations––net of tax 0.68 0.21 —
Net income attributable to Pfizer Inc. common shareholders $1.94 $1.27 $1.02
Weighted-average shares––basic 7,442 7,817 8,036
Weighted-average shares––diluted 7,508 7,870 8,074
Cash dividends paid per common share $0.88 $0.80 $0.72
(a) Exclusive of amortization of intangible assets, except as disclosed in Note 1K. Basis of Presentation and Significant Accounting Policies: Amortization of
Intangible Assets, Depreciation and Certain Long-Lived Assets.
(b) EPS amounts may not add due to rounding.
See Notes to Consolidated Financial Statements, which are an integral part of these statements.