Pfizer 2011 Annual Report Download - page 95
Download and view the complete annual report
Please find page 95 of the 2011 Pfizer annual report below. You can navigate through the pages in the report by either clicking on the pages listed below, or by using the keyword search tool below to find specific information within the annual report.-
 1
1 -
2
-
3
-
4
-
5
-
6
-
7
-
8
-
9
-
10
-
11
-
12
-
13
-
14
-
15
-
16
-
17
-
18
-
19
-
20
-
21
-
22
-
23
-
24
-
25
-
26
-
27
-
28
-
29
-
30
-
31
-
32
-
33
-
34
-
35
-
36
-
37
-
38
-
39
-
40
-
41
-
42
-
43
-
44
-
45
-
46
-
47
-
48
-
49
-
50
-
51
-
52
-
53
-
54
-
55
-
56
-
57
-
58
-
59
-
60
-
61
-
62
-
63
-
64
-
65
-
66
-
67
-
68
-
69
-
70
-
71
-
72
-
73
-
74
-
75
-
76
-
77
-
78
-
79
-
80
-
81
-
82
-
83
-
84
-
 85
85 -
 86
86 -
 87
87 -
 88
88 -
 89
89 -
 90
90 -
 91
91 -
 92
92 -
 93
93 -
 94
94 -
 95
95 -
 96
96 -
 97
97 -
 98
98 -
 99
99 -
 100
100 -
 101
101 -
 102
102 -
 103
103 -
 104
104 -
 105
105 -
106
-
107
-
108
-
109
-
110
-
111
-
112
-
113
-
114
-
115
-
116
-
117
 |
 |

Notes to Consolidated Financial Statements
Pfizer Inc. and Subsidiary Companies
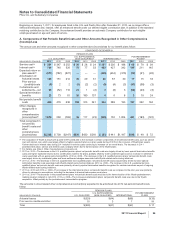
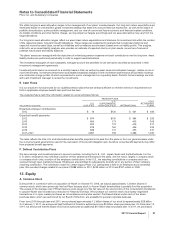
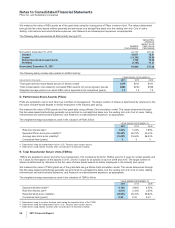
We measure the value of RSU grants as of the grant date using the closing price of Pfizer common stock. The values determined
through this fair-value-based method generally are amortized on a straight-line basis over the vesting term into Cost of sales,
Selling, informational and administrative expenses, and Research and development expenses, as appropriate.
The following table summarizes all RSU activity during 2011:
SHARES
(THOUSANDS)
WEIGHTED-
AVERAGE
GRANT DATE
FAIR VALUE
PER SHARE
Nonvested, December 31, 2010 41,177 $17.57
Granted 15,671 18.91
Vested (13,281) 20.99
Reinvested dividend equivalents 1,740 19.28
Forfeited (3,367) 17.27
Nonvested, December 31, 2011 41,940 $17.08
The following table provides data related to all RSU activity:
YEAR ENDED DECEMBER 31,
(MILLIONS OF DOLLARS) 2011 2010 2009
Total grant date fair-value-based amount of shares vested $279 $311 $131
Total compensation cost related to nonvested RSU awards not yet recognized, pre-tax $264 $230 $198
Weighted-average period over which RSU cost is expected to be recognized (years) 1.3 1.4 1.3
D. Performance Share Awards (PSAs)
PSAs are awarded to senior and other key members of management. The target number of shares is determined by reference to the
fair value of share-based awards to similar employees in the industry peer group.
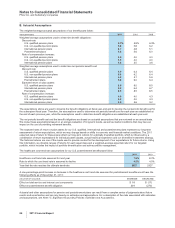
We measure the value of PSA grants as of the grant date using a Monte Carlo simulation model. The values determined through
this fair-value-based methodology generally are amortized on a straight-line basis over the vesting term into Cost of sales, Selling,
informational and administrative expenses, and Research and development expenses, as appropriate.
The weighted-average assumptions used in the valuation of PSAs follow:
YEAR ENDED DECEMBER 31,
2011 2010 2009
Risk-free interest rate(a) 1.22% 1.24% 1.95%
Expected Pfizer stock price volatility(b) 25.55% 26.75% 40.40%
Average peer stock price volatility(b) 21.63% 23.64% 36.30%
Contractual term (years) 333
(a) Determined using the interpolated yield on U.S. Treasury zero-coupon issues.
(b) Determined using implied volatility, after consideration of historical volatility.
E. Total Shareholder Return Units (TSRUs)
TSRUs are awarded to senior and other key management. The contractual terms for TSRUs were for 5 years for certain awards and
for 7 years for the balance of the awards in 2011, and for 5 years for all awards in each of 2009 and 2010. The target number of
shares is determined by reference to the fair value of share-based awards to similar employees in the industry peer group.
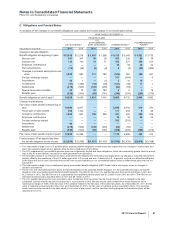
We measure the value of TSRU grants as of the grant date using a Monte Carlo simulation model. The values determined through
this fair-value-based methodology generally are amortized on a straight-line basis over the vesting term into Cost of sales, Selling,
informational and administrative expenses, and Research and development expenses, as appropriate.
The weighted-average assumptions used in the valuation of TSRUs follow:
YEAR ENDED DECEMBER 31,
2011 2010 2009
Expected dividend yield(a) 4.15% 3.99% 4.55%
Risk-free interest rate(b) 2.51% 2.34% 2.35%
Expected stock price volatility(c) 25.55% 26.76% 36.92%
Contractual term (years) 5.95 5.00 5.00
(a) Determined using a constant dividend yield during the expected term of the TSRU.
(b) Determined using the interpolated yield on U.S. Treasury zero-coupon issues.
(c) Determined using implied volatility, after consideration of historical volatility.
94 2011 Financial Report