Pfizer 2011 Annual Report Download - page 18
Download and view the complete annual report
Please find page 18 of the 2011 Pfizer annual report below. You can navigate through the pages in the report by either clicking on the pages listed below, or by using the keyword search tool below to find specific information within the annual report.-
 1
1 -
2
-
3
-
4
-
5
-
6
-
7
-
 8
8 -
 9
9 -
 10
10 -
 11
11 -
 12
12 -
 13
13 -
 14
14 -
 15
15 -
 16
16 -
 17
17 -
 18
18 -
 19
19 -
 20
20 -
 21
21 -
 22
22 -
 23
23 -
 24
24 -
 25
25 -
 26
26 -
 27
27 -
 28
28 -
29
-
30
-
31
-
32
-
33
-
34
-
35
-
36
-
37
-
38
-
39
-
40
-
41
-
42
-
43
-
44
-
45
-
46
-
47
-
48
-
49
-
50
-
51
-
52
-
53
-
54
-
55
-
56
-
57
-
58
-
59
-
60
-
61
-
62
-
63
-
64
-
65
-
66
-
67
-
68
-
69
-
70
-
71
-
72
-
73
-
74
-
75
-
76
-
77
-
78
-
79
-
80
-
81
-
82
-
83
-
84
-
85
-
86
-
87
-
88
-
89
-
90
-
91
-
92
-
93
-
94
-
95
-
96
-
97
-
98
-
99
-
100
-
101
-
102
-
103
-
104
-
105
-
106
-
107
-
108
-
109
-
110
-
111
-
112
-
113
-
114
-
115
-
116
-
117
 |
 |

Financial Review
Pfizer Inc. and Subsidiary Companies
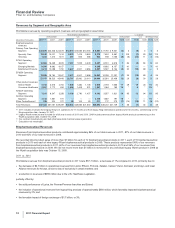
Revenues exceeded $500 million in each of 18 countries outside the U.S. in 2011 and 2010, and in each of 13 countries outside the
U.S. in 2009. The increase in the number of countries outside the U.S. in which revenues exceeded $500 million in 2010 and 2011
compared to 2009 was due to the inclusion of revenues from legacy Wyeth products for the full year in 2010. The U.S. was the only
country to contribute more than 10% of total revenues in each year.
Our policy relating to the supply of pharmaceutical inventory at domestic wholesalers, and in major international markets, is to
generally maintain stocking levels under one month on average and to keep monthly levels consistent from year to year based on
patterns of utilization. We historically have been able to closely monitor these customer stocking levels by purchasing information
from our customers directly or by obtaining other third-party information. We believe our data sources to be directionally reliable but
cannot verify their accuracy. Further, as we do not control this third-party data, we cannot be assured of continuing access. Unusual
buying patterns and utilization are promptly investigated.
As is typical in the biopharmaceutical industry, our gross product sales are subject to a variety of deductions, that generally are
estimated and recorded in the same period that the revenues are recognized and primarily represent rebates and discounts to
government agencies, wholesalers, distributors and managed care organizations with respect to our pharmaceutical products.
These deductions represent estimates of the related obligations and, as such, judgment and knowledge of market conditions and
practice are required when estimating the impact of these sales deductions on gross sales for a reporting period. Historically, our
adjustments to actual results have not been material to our overall business. On a quarterly basis, our adjustments to actual results
generally have been less than 1% of biopharmaceutical net sales and can result in either a net increase or a net decrease in
income. Product-specific rebate charges, however, can have a significant impact on year-over-year individual product growth trends.
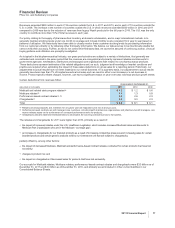
Certain deductions from revenues follow:
YEAR ENDED DECEMBER 31,
(BILLIONS OF DOLLARS) 2011 2010 2009
Medicaid and related state program rebates(a) $ 1.2 $ 1.2 $ 0.6
Medicare rebates(a) 1.4 1.3 0.9
Performance-based contract rebates(a), (b) 3.0 2.6 2.3
Chargebacks(c) 3.2 3.0 2.3
Total $ 8.8 $ 8.1 $ 6.1
(a) Rebates are product-specific and, therefore, for any given year are impacted by the mix of products sold.
(b) Performance-based contracts are with managed care customers, including health maintenance organizations and pharmacy benefit managers, who
receive rebates based on the achievement of contracted performance terms for products.
(c) Chargebacks primarily represent reimbursements to wholesalers for honoring contracted prices to third parties.
The rebates and chargebacks for 2011 were higher than 2010, primarily as a result of:
•the impact of increased rebates under the U.S. Healthcare Legislation, which includes increased Medicaid rates and discounts to
Medicare Part D participants who are in the Medicare “coverage gap”;
•an increase in chargebacks for our branded products as a result of increasing competitive pressures and increasing sales for certain
branded products and certain generic products sold by our Greenstone unit that are subject to chargebacks,
partially offset by, among other factors:
•the impact of decreased Medicare, Medicaid and performance-based contract rebates contracted for certain products that have lost
exclusivity;
•changes in product mix; and
•the impact on chargebacks of decreased sales for products that have lost exclusivity.
Our accruals for Medicaid rebates, Medicare rebates, performance-based contract rebates and chargebacks were $3.3 billion as of
December 31, 2011 and $3.0 billion as of December 31, 2010, and primarily are all included in Other current liabilities in our
Consolidated Balance Sheets.
2011 Financial Report 17