Pfizer 2011 Annual Report Download - page 115
Download and view the complete annual report
Please find page 115 of the 2011 Pfizer annual report below. You can navigate through the pages in the report by either clicking on the pages listed below, or by using the keyword search tool below to find specific information within the annual report.-
 1
1 -
2
-
3
-
4
-
5
-
6
-
7
-
8
-
9
-
10
-
11
-
12
-
13
-
14
-
15
-
16
-
17
-
18
-
19
-
20
-
21
-
22
-
23
-
24
-
25
-
26
-
27
-
28
-
29
-
30
-
31
-
32
-
33
-
34
-
35
-
36
-
37
-
38
-
39
-
40
-
41
-
42
-
43
-
44
-
45
-
46
-
47
-
48
-
49
-
50
-
51
-
52
-
53
-
54
-
55
-
56
-
57
-
58
-
59
-
60
-
61
-
62
-
63
-
64
-
65
-
66
-
67
-
68
-
69
-
70
-
71
-
72
-
73
-
74
-
75
-
76
-
77
-
78
-
79
-
80
-
81
-
82
-
83
-
84
-
85
-
86
-
87
-
88
-
89
-
90
-
91
-
92
-
93
-
94
-
95
-
96
-
97
-
98
-
99
-
100
-
101
-
102
-
103
-
104
-
 105
105 -
 106
106 -
 107
107 -
 108
108 -
 109
109 -
 110
110 -
 111
111 -
 112
112 -
 113
113 -
 114
114 -
 115
115 -
 116
116 -
 117
117
 |
 |

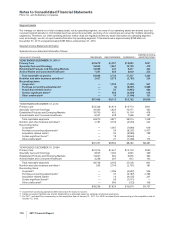
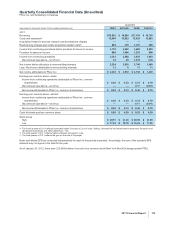
Quarterly Consolidated Financial Data (Unaudited)
Pfizer Inc. and Subsidiary Companies
QUARTER
(MILLIONS OF DOLLARS, EXCEPT PER COMMON SHARE DATA) FIRST SECOND THIRD FOURTH
2010
Revenues $16,576 $ 17,132 $15,995 $ 17,354
Costs and expenses(a) 12,647 12,321 14,082 15,399
Acquisition-related in-process research and development charges 74 — — 51
Restructuring charges and certain acquisition-related costs(b) 706 885 499 1,111
Income from continuing operations before provision/(benefit) for taxes on income 3,149 3,926 1,414 793
Provision/(benefit) for taxes on income(c) 1,135 1,472 558 (2,094)
Income from continuing operations 2,014 2,454 856 2,887
Discontinued operations—net of tax 21 31 15 10
Net income before allocation to noncontrolling interests 2,035 2,485 871 2,897
Less: Net income attributable to noncontrolling interests 9 10 5 7
Net income attributable to Pfizer Inc. $ 2,026 $ 2,475 $ 866 $ 2,890
Earnings per common share—basic:
Income from continuing operations attributable to Pfizer Inc. common
shareholders $ 0.25 $ 0.30 $ 0.11 $ 0.36
Discontinued operations—net of tax — — — —
Net income attributable to Pfizer Inc. common shareholders $ 0.25 $ 0.31 $ 0.11 $ 0.36
Earnings per common share—diluted:
Income from continuing operations attributable to Pfizer Inc. common
shareholders $ 0.25 $ 0.30 $ 0.11 $ 0.36
Discontinued operations—net of tax — — — —
Net income attributable to Pfizer Inc. common shareholders $ 0.25 $ 0.31 $ 0.11 $ 0.36
Cash dividends paid per common share $ 0.18 $ 0.18 $ 0.18 $ 0.18
Stock prices
High $ 20.36 $ 17.39 $ 17.50 $ 17.90
Low $ 16.80 $ 14.00 $ 14.14 $ 16.25
(a) The fourth quarter of 2010 reflects historically higher Q4 costs in Cost of sales and Selling, informational and administrative expenses, partially
offset by lower charges recorded in Other deductions—net.
(b) The fourth quarter of 2010 reflects higher integration charges and restructuring costs, primarily related to our acquisition of Wyeth.
(c) The fourth quarter of 2010 includes a $2.0 billion tax benefit recorded as a result of a settlement of certain tax audits covering the years 2002-2005.
Basic and diluted EPS are computed independently for each of the periods presented. Accordingly, the sum of the quarterly EPS
amounts may not agree to the total for the year.
114 2011 Financial Report