Pfizer 2009 Annual Report Download - page 39
Download and view the complete annual report
Please find page 39 of the 2009 Pfizer annual report below. You can navigate through the pages in the report by either clicking on the pages listed below, or by using the keyword search tool below to find specific information within the annual report.-
 1
1 -
2
-
3
-
4
-
5
-
6
-
7
-
8
-
9
-
10
-
11
-
12
-
13
-
14
-
15
-
16
-
17
-
18
-
19
-
20
-
21
-
22
-
23
-
24
-
25
-
26
-
27
-
28
-
 29
29 -
 30
30 -
 31
31 -
 32
32 -
 33
33 -
 34
34 -
 35
35 -
 36
36 -
 37
37 -
 38
38 -
 39
39 -
 40
40 -
 41
41 -
 42
42 -
 43
43 -
 44
44 -
 45
45 -
 46
46 -
 47
47 -
 48
48 -
 49
49 -
50
-
51
-
52
-
53
-
54
-
55
-
56
-
57
-
58
-
59
-
60
-
61
-
62
-
63
-
64
-
65
-
66
-
67
-
68
-
69
-
70
-
71
-
72
-
73
-
74
-
75
-
76
-
77
-
78
-
79
-
80
-
81
-
82
-
83
-
84
-
85
-
86
-
87
-
88
-
89
-
90
-
91
-
92
-
93
-
94
-
95
-
96
-
97
-
98
-
99
-
100
-
101
-
102
-
103
-
104
-
105
-
106
-
107
-
108
-
109
-
110
 |
 |

Financial Review
Pfizer Inc. and Subsidiary Companies
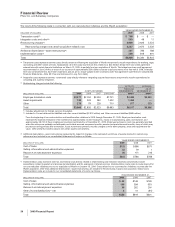
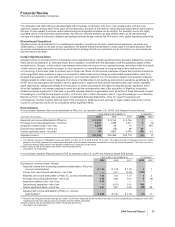
Operating Activities
Our net cash provided by continuing operating activities was $16.6 billion in 2009 compared to $18.2 billion in 2008. The decrease in
net cash provided by operating activities was primarily attributable to:
•The payments in connection with the resolution of certain legal matters related to Bextra and certain other products, and our NSAID
pain medicines of approximately $3.2 billion (see Notes to Consolidated Financial Statements––Note 3C. Other Significant
Transactions and Events: Bextra and Certain Other Investigations); and
•the timing of other receipts and payments in the ordinary course of business.
Our net cash provided by continuing operating activities was $18.2 billion in 2008 compared to $13.4 billion in 2007. The increase in
net cash provided by operating activities was primarily attributable to:
•lower tax payments ($3.4 billion) made in 2008, primarily due to the higher taxes paid in 2007, substantially all of which related to the
gain on the sale of our former consumer healthcare business in December 2006;
•the sale of certain royalty rights ($425 million); and
•the timing of other receipts and payments in the ordinary course of business.
In 2009, the cash flow line item called Inventories primarily reflects the charge for the fair value adjustment for inventory acquired
from Wyeth that has been sold, and the cash flow line item called Taxes reflects current taxes provided but not yet paid due to the
increased tax costs associated with certain business decisions executed to finance the Wyeth acquisition. In 2008, the cash flow line
item called Accounts payable and accrued liabilities primarily reflects the $3.2 billion accrued in 2008 for the resolution of certain
legal matters related to Bextra and various other products and our NSAID pain medicines that had not yet been paid as of
December 31, 2008. In 2007, the cash flow line item called Taxes primarily reflects the taxes paid in 2007 that were previously
provided on the gain on the sale of our former consumer healthcare business.
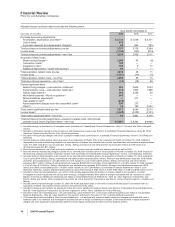
Investing Activities
Our net cash used in investing activities was $31.3 billion in 2009 compared to $12.8 billion in 2008. The increase in net cash used
in investing activities was primarily attributable to:
•net cash paid for the acquisition of Wyeth.
partially offset by:
•net proceeds from redemptions and sales of investments of $12.4 billion in 2009 compared to net purchases of investments of $8.3
billion in 2008.
Our net cash used in investing activities was $12.8 billion in 2008 compared to net cash provided by investing activities of $795
million in 2007. The change in net cash provided by investing activities was primarily attributable to:
•net purchases of investments of $8.3 billion in 2008 compared to net sales and redemptions of investments of $3.4 billion in 2007; and
•the acquisitions of Serenex, Encysive, CovX, Coley and animal health product lines from Schering-Plough, as well as two smaller
animal health acquisitions in 2008 compared to the acquisitions of BioRexis and Embrex in 2007.
In 2008, the cash flow line item called Other investing activities primarily reflects a $1.2 billion payment by us upon the redemption of
a Swedish krona currency swap. In a related transaction, this payment was offset by the receipt of cash in our operating activities.
Financing Activities
Our net cash provided by financing activities was $14.5 billion in 2009 compared to net cash used in financing activities of $6.6
billion in 2008. The change in cash activity for financing activities was primarily attributable to:
•net borrowings of $20.1 billion in 2009, primarily reflecting the proceeds from our issuance of $13.5 billion of senior unsecured notes in
the first quarter of 2009 and the proceeds from our issuance of approximately $10.5 billion of senior unsecured notes in the second
quarter of 2009 compared to net borrowings of $2.4 billion in 2008;
•lower dividend payments in 2009 compared to 2008; and
•no open market purchases of common stock in 2009 compared to $500 million of purchases in 2008.
Our net cash used in financing activities was $6.6 billion in 2008 compared to $12.6 billion in 2007. The decrease in net cash used
in financing activities was primarily attributable to:
•lower purchases of common stock of $500 million in 2008 compared to $10.0 billion in 2007,
2009 Financial Report 37