Pfizer 2009 Annual Report Download - page 18
Download and view the complete annual report
Please find page 18 of the 2009 Pfizer annual report below. You can navigate through the pages in the report by either clicking on the pages listed below, or by using the keyword search tool below to find specific information within the annual report.-
 1
1 -
2
-
3
-
4
-
5
-
6
-
7
-
 8
8 -
 9
9 -
 10
10 -
 11
11 -
 12
12 -
 13
13 -
 14
14 -
 15
15 -
 16
16 -
 17
17 -
 18
18 -
 19
19 -
 20
20 -
 21
21 -
 22
22 -
 23
23 -
 24
24 -
 25
25 -
 26
26 -
 27
27 -
 28
28 -
29
-
30
-
31
-
32
-
33
-
34
-
35
-
36
-
37
-
38
-
39
-
40
-
41
-
42
-
43
-
44
-
45
-
46
-
47
-
48
-
49
-
50
-
51
-
52
-
53
-
54
-
55
-
56
-
57
-
58
-
59
-
60
-
61
-
62
-
63
-
64
-
65
-
66
-
67
-
68
-
69
-
70
-
71
-
72
-
73
-
74
-
75
-
76
-
77
-
78
-
79
-
80
-
81
-
82
-
83
-
84
-
85
-
86
-
87
-
88
-
89
-
90
-
91
-
92
-
93
-
94
-
95
-
96
-
97
-
98
-
99
-
100
-
101
-
102
-
103
-
104
-
105
-
106
-
107
-
108
-
109
-
110
 |
 |

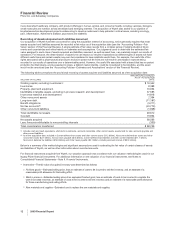
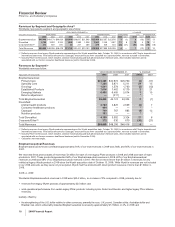
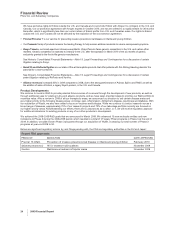
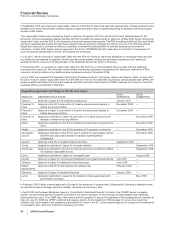
Financial Review
Pfizer Inc. and Subsidiary Companies
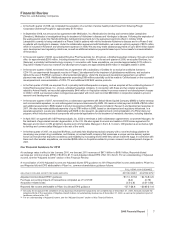
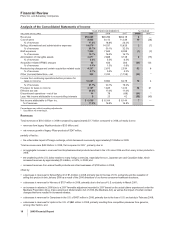
Analysis of the Consolidated Statements of Income
YEAR ENDED DECEMBER 31, % CHANGE
(MILLIONS OF DOLLARS) 2009 2008 2007 09/08 08/07
Revenues $50,009 $48,296 $48,418 4—
Cost of sales 8,888 8,112 11,239 10 (28)
% of revenues 17.8% 16.8% 23.2%
Selling, informational and administrative expenses 14,875 14,537 15,626 2(7)
% of revenues 29.7% 30.1% 32.3%
R&D expenses 7,845 7,945 8,089 (1) (2)
% of revenues 15.7% 16.5% 16.7%
Amortization of intangible assets 2,877 2,668 3,128 8(15)
% of revenues 5.8% 5.5% 6.5%
Acquisition-related IPR&D charges 68 633 283 (89) 123
% of revenues 0.1% 1.3% 0.6%
Restructuring charges and certain acquisition-related costs 4,337 2,675 2,534 62 6
% of revenues 8.7% 5.5% 5.2%
Other (income)/deductions—net 292 2,032 (1,759) (86) *
Income from continuing operations before provision for
taxes on income 10,827 9,694 9,278 12 4
% of revenues 21.7% 20.1% 19.2%
Provision for taxes on income 2,197 1,645 1,023 34 61
Effective tax rate 20.3% 17.0% 11.0%
Discontinued operations—net of tax 14 78 (69) (81) *
Less: Net income attributable to noncontrolling interests 923 42 (59) (45)
Net income attributable to Pfizer Inc. $ 8,635 $ 8,104 $ 8,144 7—
% of revenues 17.3% 16.8% 16.8%
Percentages may reflect rounding adjustments.
* Calculation not meaningful.
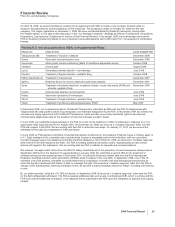
Revenues
Total revenues of $50.0 billion in 2009 increased by approximately $1.7 billion compared to 2008, primarily due to:
•revenues from legacy Wyeth products of $3.3 billion; and
•net revenue growth of legacy Pfizer products of $247 million,
partially offset by:
•the unfavorable impact of foreign exchange, which decreased revenues by approximately $1.8 billion in 2009.
Total revenues were $48.3 billion in 2008, flat compared to 2007, primarily due to:
•an aggregate increase in revenues from Biopharmaceutical products launched in the U.S. since 2006 and from many in-line products in
2008;
•the weakening of the U.S. dollar relative to many foreign currencies, especially the euro, Japanese yen and Canadian dollar, which
increased revenues by approximately $1.6 billion, or 3.3%, in 2008; and
•increased revenues from animal health products and other businesses of $128 million in 2008,
offset by:
•a decrease in revenues for Zyrtec/Zyrtec D of $1.4 billion in 2008, primarily due to the loss of U.S. exclusivity and the cessation of
selling this product in late January 2008 as a result of the 2006 divestiture of our former consumer healthcare business;
•a decrease in revenues for Norvasc of $757 million in 2008, primarily due to the loss of U.S. exclusivity in March 2007;
•an increase in rebates in 2008 due to a 2007 favorable adjustment recorded in 2007 based on the actual claims experienced under the
Medicare Prescription Drug, Improvement and Modernization Act of 2003 (the Medicare Act), as well as the impact of certain contract
changes that have resulted in increased rebates;
•a decrease in revenues for Camptosar in the U.S. of $457 million in 2008, primarily due to the loss of U.S. exclusivity in February 2008;
•a decrease in revenues for Lipitor in the U.S. of $863 million in 2008, primarily resulting from competitive pressures from generics,
among other factors; and
16 2009 Financial Report