Pfizer 2009 Annual Report Download - page 30
Download and view the complete annual report
Please find page 30 of the 2009 Pfizer annual report below. You can navigate through the pages in the report by either clicking on the pages listed below, or by using the keyword search tool below to find specific information within the annual report.-
 1
1 -
2
-
3
-
4
-
5
-
6
-
7
-
8
-
9
-
10
-
11
-
12
-
13
-
14
-
15
-
16
-
17
-
18
-
19
-
 20
20 -
 21
21 -
 22
22 -
 23
23 -
 24
24 -
 25
25 -
 26
26 -
 27
27 -
 28
28 -
 29
29 -
 30
30 -
 31
31 -
 32
32 -
 33
33 -
 34
34 -
 35
35 -
 36
36 -
 37
37 -
 38
38 -
 39
39 -
 40
40 -
41
-
42
-
43
-
44
-
45
-
46
-
47
-
48
-
49
-
50
-
51
-
52
-
53
-
54
-
55
-
56
-
57
-
58
-
59
-
60
-
61
-
62
-
63
-
64
-
65
-
66
-
67
-
68
-
69
-
70
-
71
-
72
-
73
-
74
-
75
-
76
-
77
-
78
-
79
-
80
-
81
-
82
-
83
-
84
-
85
-
86
-
87
-
88
-
89
-
90
-
91
-
92
-
93
-
94
-
95
-
96
-
97
-
98
-
99
-
100
-
101
-
102
-
103
-
104
-
105
-
106
-
107
-
108
-
109
-
110
 |
 |

Financial Review
Pfizer Inc. and Subsidiary Companies
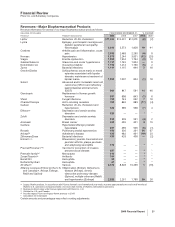
Additional product-related programs are in various stages of discovery and development. Also, see the discussion in the “Our
Strategic Initiatives––Strategy and Recent Transactions: Acquisitions, Dispositions, Licensing and Collaborations” section of this
Financial Review.
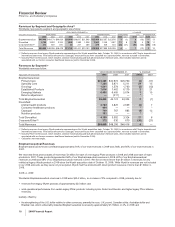
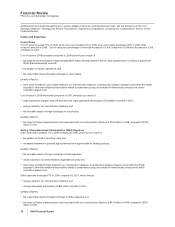
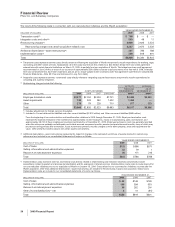
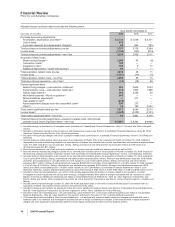
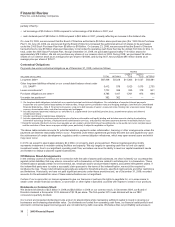
Costs and Expenses
Cost of Sales
Cost of sales increased 10% in 2009, while revenues increased 4% in 2009, and cost of sales decreased 28% in 2008, while
revenues were flat in 2008. Cost of sales as a percentage of revenues increased in 2009 compared to 2008 and decreased in 2008
compared to 2007.
Cost of sales in 2009 increased compared to 2008 primarily as a result of:
•purchase accounting charges of approximately $970 million primarily related to the fair value adjustments to inventory acquired from
Wyeth that subsequently was sold;
•the addition of Wyeth’s operations; and
•the unfavorable impact of foreign exchange on cost of sales,
partially offset by:
•lower costs recorded in cost of sales related to our cost-reduction initiatives. Cost-reduction initiative charges incurred after the Wyeth
acquisition, other than additional depreciation related to asset restructuring, are included in Restructuring charges and certain
acquisition-related costs.
Cost of sales in 2008 decreased compared to 2007 primarily as a result of:
•asset impairment charges, write-offs and other exit costs associated with Exubera of $2.6 billion recorded in 2007;
•savings related to our cost-reduction initiatives; and
•the favorable impact of foreign exchange on cost of sales,
partially offset by:
•the impact of higher implementation costs associated with our cost-reduction initiatives of $745 million in 2008, compared to $700
million in 2007.
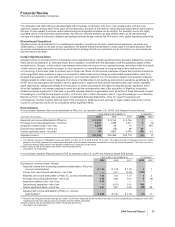
Selling, Informational and Administrative (SI&A) Expenses
SI&A expenses increased 2% in 2009 compared to 2008, primarily as a result of:
•the addition of Wyeth’s operating costs; and
•increased investment in potential high-growth and new opportunities for existing products,
partially offset by:
•the favorable impact of foreign exchange on SI&A expenses;
•certain insurance recoveries related to legal defense costs; and
•lower costs recorded in SI&A related to our cost-reduction initiatives. Cost-reduction initiative charges incurred after the Wyeth
acquisition, other than additional depreciation related to asset restructuring, are included in Restructuring charges and certain
acquisition-related costs.
SI&A expenses decreased 7% in 2008 compared to 2007, which reflects:
•savings related to our cost-reduction initiatives; and
•charges associated with Exubera of $85 million recorded in 2007,
partially offset by:
•the unfavorable impact of foreign exchange on SI&A expenses; and
•the impact of higher implementation costs associated with our cost-reduction initiatives of $413 million in 2008 compared to $334
million in 2007.
28 2009 Financial Report