Pfizer 2009 Annual Report Download - page 106
Download and view the complete annual report
Please find page 106 of the 2009 Pfizer annual report below. You can navigate through the pages in the report by either clicking on the pages listed below, or by using the keyword search tool below to find specific information within the annual report.-
 1
1 -
2
-
3
-
4
-
5
-
6
-
7
-
8
-
9
-
10
-
11
-
12
-
13
-
14
-
15
-
16
-
17
-
18
-
19
-
20
-
21
-
22
-
23
-
24
-
25
-
26
-
27
-
28
-
29
-
30
-
31
-
32
-
33
-
34
-
35
-
36
-
37
-
38
-
39
-
40
-
41
-
42
-
43
-
44
-
45
-
46
-
47
-
48
-
49
-
50
-
51
-
52
-
53
-
54
-
55
-
56
-
57
-
58
-
59
-
60
-
61
-
62
-
63
-
64
-
65
-
66
-
67
-
68
-
69
-
70
-
71
-
72
-
73
-
74
-
75
-
76
-
77
-
78
-
79
-
80
-
81
-
82
-
83
-
84
-
85
-
86
-
87
-
88
-
89
-
90
-
91
-
92
-
93
-
94
-
95
-
 96
96 -
 97
97 -
 98
98 -
 99
99 -
 100
100 -
 101
101 -
 102
102 -
 103
103 -
 104
104 -
 105
105 -
 106
106 -
 107
107 -
 108
108 -
 109
109 -
 110
110
 |
 |

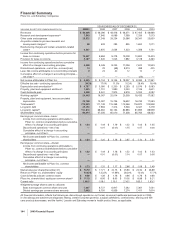
Financial Summary
Pfizer Inc. and Subsidiary Companies
YEAR ENDED/AS OF DECEMBER 31,
(MILLIONS, EXCEPT PER COMMON SHARE DATA) 2009(a) 2008 2007 2006 2005 2004
Revenues $ 50,009 $ 48,296 $ 48,418 $ 48,371 $ 47,405 $ 48,988
Research and development expenses(b) 7,845 7,945 8,089 7,599 7,256 7,513
Other costs and expenses 26,932 27,349 28,234 25,586 26,341 25,850
Acquisition-related in-process research and
development charges(c) 68 633 283 835 1,652 1,071
Restructuring charges and certain acquisition-related
costs(d) 4,337 2,675 2,534 1,323 1,356 1,151
Income from continuing operations before provision for
taxes on income 10,827 9,694 9,278 13,028 10,800 13,403
Provision for taxes on income 2,197 1,645 1,023 1,992 3,178 2,460
Income from continuing operations before cumulative
effect of a change in accounting principles 8,630 8,049 8,255 11,036 7,622 10,943
Discontinued operations—net of tax—income/(loss) 14 78 (69) 8,313 498 425
Less: Net income attributable to noncontrolling interests 923 42 12 12 7
Cumulative effect of a change in accounting principles—
net of tax(d) —— — — (23) —
Net income attributable to Pfizer Inc. $ 8,635 $ 8,104 $ 8,144 $ 19,337 $ 8,085 $ 11,361
Effective tax rate—continuing operations 20.3% 17.0% 11.0% 15.3% 29.4% 18.4%
Depreciation and amortization(f) $ 4,757 $ 5,090 $ 5,200 $ 5,293 $ 5,576 $ 5,093
Property, plant and equipment additions(f) 1,205 1,701 1,880 2,050 2,106 2,601
Cash dividends paid 5,548 8,541 7,975 6,919 5,555 5,082
Working capital(g) 24,445 16,067 25,014 25,559 18,433 17,582
Property, plant and equipment, less accumulated
depreciation 22,780 13,287 15,734 16,632 16,233 17,593
Total assets(g) 212,949 111,148 115,268 115,546 116,970 125,848
Long-term debt 43,193 7,963 7,314 5,546 6,347 7,279
Long-term capital(h) 151,478 68,662 80,134 84,993 81,895 88,959
Shareholders’ equity 90,014 57,556 65,010 71,358 65,764 68,433
Earnings per common share—basic:
Income from continuing operations attributable to
Pfizer Inc. common shareholders before cumulative
effect of a change in accounting principles $ 1.23 $ 1.19 $ 1.19 $ 1.52 $ 1.03 $ 1.45
Discontinued operations—net of tax —0.01 (0.01) 1.15 0.07 0.06
Cumulative effect of a change in accounting
principles—net of tax(e) ——————
Net income attributable to Pfizer Inc. common
shareholders $ 1.23 $ 1.20 $ 1.18 $ 2.67 $ 1.10 $ 1.51
Earnings per common share—diluted:
Income from continuing operations attributable to
Pfizer Inc. common shareholders before cumulative
effect of a change in accounting principles $ 1.23 $ 1.19 $ 1.18 $ 1.52 $ 1.02 $ 1.43
Discontinued operations—net of tax —0.01 (0.01) 1.14 0.07 0.06
Cumulative effect of a change in accounting
principles—net of tax(e) ——————
Net income attributable to Pfizer Inc. common
shareholders $ 1.23 $ 1.20 $ 1.17 $ 2.66 $ 1.09 $ 1.49
Market value per share (December 31) $ 18.19 $ 17.71 $ 22.73 $ 25.90 $ 23.32 $ 26.89
Return on Pfizer Inc. shareholders’ equity 13.42% 13.22% 11.94% 28.20% 12.0% 17.7%
Cash dividends paid per common share $ 0.80 $ 1.28 $ 1.16 $ 0.96 $ 0.76 $ 0.68
Pfizer Inc. shareholders’ equity per common share(i) $ 11.19 $ 8.56 $ 9.65 $ 10.05 $ 8.98 $ 9.21
Current ratio 1.66:1 1.59:1 2.15:1 2.16:1 1.65:1 1.63:1
Weighted-average shares used to calculate:
Basic earnings per common share amounts 7,007 6,727 6,917 7,242 7,361 7,531
Diluted earnings per common share amounts 7,045 6,750 6,939 7,274 7,411 7,614
All financial information reflects the following as discontinued operations: our former consumer healthcare business (sold in 2006),
in-vitro allergy and autoimmune diagnostic testing, certain European generics, surgical ophthalmic, confectionery, shaving and fish-
care products businesses, and the femhrt, Loestrin and Estrostep women’s health product lines, as applicable.
104 2009 Financial Report