Petsmart 2002 Annual Report Download - page 3
Download and view the complete annual report
Please find page 3 of the 2002 Petsmart annual report below. You can navigate through the pages in the report by either clicking on the pages listed below, or by using the keyword search tool below to find specific information within the annual report.-
 1
1 -
 2
2 -
 3
3 -
 4
4 -
 5
5 -
 6
6 -
 7
7 -
 8
8 -
 9
9 -
 10
10 -
 11
11 -
 12
12 -
 13
13 -
 14
14 -
15
-
16
-
17
-
18
-
19
-
20
-
21
-
22
-
23
-
24
-
25
-
26
-
27
-
28
-
29
-
30
-
31
-
32
-
33
-
34
-
35
-
36
-
37
-
38
-
39
-
40
-
41
-
42
-
43
-
44
-
45
-
46
-
47
-
48
-
49
-
50
-
51
-
52
-
53
-
54
-
55
-
56
-
57
-
58
-
59
-
60
-
61
-
62
-
63
-
64
-
65
-
66
-
67
-
68
-
69
-
70
-
71
-
72
-
73
-
74
-
75
-
76
-
77
-
78
-
79
-
80
-
81
-
82
-
83
-
84
-
85
 |
 |

1
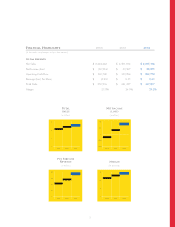
FINANCIAL HIGHLIGHTS 2000 2001 2002
(In thousands, except margins and per-share amounts)
TOTAL RESULTS
Net Sales $ 2,224,222 $2,501,012 $2,695,184
Net Income (loss) $ (30,904) $39,567 $88,855
Operating Cash Flow $ 110,700 $189,994 $222,770
Earnings (loss) Per Share $ (0.28) $0.35 $0.63
Total Debt $ 253,936 $341,387 $167,007
Margin 23.8% 26.9% 29.2%
NET INCOME
(LOSS)
(in millions)
PET SERVICES
REVENUE
(in millions)
MARGIN
(by percentage)
TOTAL
SALES
(in billions)
2000 2001 2002
3
2
1
0
2000 2001 2002
100
50
0
(50)
(100)
2000 2001 2002
160
120
80
40
0
2000 2001 2002
30
20
10
0