Pepsi 2015 Annual Report Download - page 4
Download and view the complete annual report
Please find page 4 of the 2015 Pepsi annual report below. You can navigate through the pages in the report by either clicking on the pages listed below, or by using the keyword search tool below to find specific information within the annual report.-
 1
1 -
 2
2 -
 3
3 -
 4
4 -
 5
5 -
 6
6 -
 7
7 -
 8
8 -
 9
9 -
 10
10 -
 11
11 -
 12
12 -
 13
13 -
 14
14 -
 15
15 -
 16
16 -
 17
17 -
 18
18 -
 19
19 -
 20
20 -
 21
21 -
 22
22 -
 23
23 -
 24
24 -
 25
25 -
 26
26 -
 27
27 -
 28
28 -
 29
29 -
 30
30 -
 31
31 -
 32
32 -
 33
33 -
 34
34 -
 35
35 -
 36
36 -
 37
37 -
 38
38 -
 39
39 -
 40
40 -
 41
41 -
 42
42 -
 43
43 -
 44
44 -
 45
45 -
 46
46 -
 47
47 -
 48
48 -
 49
49 -
 50
50 -
 51
51 -
 52
52 -
 53
53 -
 54
54 -
 55
55 -
 56
56 -
 57
57 -
 58
58 -
 59
59 -
 60
60 -
 61
61 -
 62
62 -
 63
63 -
 64
64 -
 65
65 -
 66
66 -
 67
67 -
 68
68 -
 69
69 -
 70
70 -
 71
71 -
 72
72 -
 73
73 -
 74
74 -
 75
75 -
 76
76 -
 77
77 -
 78
78 -
 79
79 -
 80
80 -
 81
81 -
 82
82 -
 83
83 -
 84
84 -
 85
85 -
 86
86 -
 87
87 -
 88
88 -
 89
89 -
 90
90 -
 91
91 -
 92
92 -
 93
93 -
 94
94 -
 95
95 -
 96
96 -
 97
97 -
 98
98 -
 99
99 -
 100
100 -
 101
101 -
 102
102 -
 103
103 -
 104
104 -
 105
105 -
 106
106 -
 107
107 -
 108
108 -
 109
109 -
 110
110 -
 111
111 -
 112
112 -
 113
113 -
 114
114 -
 115
115 -
 116
116 -
 117
117 -
 118
118 -
 119
119 -
 120
120 -
 121
121 -
 122
122 -
 123
123 -
 124
124 -
 125
125 -
 126
126 -
 127
127 -
 128
128 -
 129
129 -
 130
130 -
 131
131 -
 132
132 -
 133
133 -
 134
134 -
 135
135 -
 136
136 -
 137
137 -
 138
138 -
 139
139 -
 140
140 -
 141
141 -
 142
142 -
 143
143 -
 144
144 -
 145
145 -
 146
146 -
 147
147 -
 148
148 -
 149
149 -
 150
150 -
 151
151 -
 152
152 -
 153
153 -
 154
154 -
 155
155 -
 156
156 -
 157
157 -
 158
158 -
 159
159 -
 160
160 -
 161
161 -
 162
162 -
 163
163 -
 164
164 -
 165
165 -
 166
166 -
 167
167 -
 168
168
 |
 |

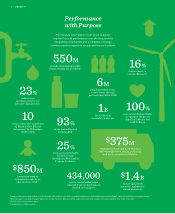
Performance
with Purpose
Performance with Purpose is our vision to deliver
top-tier financial performance over the long term by
integrating sustainability into our business strategy,
leaving a positive imprint on society and the environment.
550M
pounds of packaging weight
removed from our portfolio*
434,000
metric tons of added sugar
removed from our beverages in
the U.S. & Canada***
23%
reduction in
operational water use
per unit of production*
10
consecutive years named one
of World’s Most Ethical
Companies® by Ethisphere
(2007–2016)
$375M
estimated cost savings achieved since
2010 through water, energy, packaging
and waste-reduction initiatives
6M
people provided access
to safe water through
partnerships (2008–2014)
$1.4B
money spent with
minority- and women-
owned businesses
93%
of our waste diverted
from landfi ll
25%
increase in sustainably
farmed acreage
through our Sustainable
Farming Initiative
1B
liter reduction
in absolute water use
16%
improvement in
energy e ciency*
100%
score on the Human Rights
Campaign’sCorporate
Equality Indexfor our
LGBT e orts
$850M
invested to support
communities where we
operate since 2006**
Except as otherwise noted, all data is as of December 2014 and from our 2014 Sustainability Report and Global Reporting Initiative Report, which are available at www.pepsico.com.
*Measured against our global “legacy” operations as they existed in 2006, excluding major acquisitions and mergers while accounting for divestitures after 2006.
**Includes PepsiCo Foundation grants.
***Compared to our 2006 baseline.
2 PEPSICO
