Pepsi 2015 Annual Report Download - page 12
Download and view the complete annual report
Please find page 12 of the 2015 Pepsi annual report below. You can navigate through the pages in the report by either clicking on the pages listed below, or by using the keyword search tool below to find specific information within the annual report.-
 1
1 -
 2
2 -
 3
3 -
 4
4 -
 5
5 -
 6
6 -
 7
7 -
 8
8 -
 9
9 -
 10
10 -
 11
11 -
 12
12 -
 13
13 -
 14
14 -
 15
15 -
 16
16 -
 17
17 -
 18
18 -
 19
19 -
 20
20 -
 21
21 -
 22
22 -
23
-
24
-
25
-
26
-
27
-
28
-
29
-
30
-
31
-
32
-
33
-
34
-
35
-
36
-
37
-
38
-
39
-
40
-
41
-
42
-
43
-
44
-
45
-
46
-
47
-
48
-
49
-
50
-
51
-
52
-
53
-
54
-
55
-
56
-
57
-
58
-
59
-
60
-
61
-
62
-
63
-
64
-
65
-
66
-
67
-
68
-
69
-
70
-
71
-
72
-
73
-
74
-
75
-
76
-
77
-
78
-
79
-
80
-
81
-
82
-
83
-
84
-
85
-
86
-
87
-
88
-
89
-
90
-
91
-
92
-
93
-
94
-
95
-
96
-
97
-
98
-
99
-
100
-
101
-
102
-
103
-
104
-
105
-
106
-
107
-
108
-
109
-
110
-
111
-
112
-
113
-
114
-
115
-
116
-
117
-
118
-
119
-
120
-
121
-
122
-
123
-
124
-
125
-
126
-
127
-
128
-
129
-
130
-
131
-
132
-
133
-
134
-
135
-
136
-
137
-
138
-
139
-
140
-
141
-
142
-
143
-
144
-
145
-
146
-
147
-
148
-
149
-
150
-
151
-
152
-
153
-
154
-
155
-
156
-
157
-
158
-
159
-
160
-
161
-
162
-
163
-
164
-
165
-
166
-
167
-
168
 |
 |

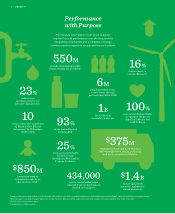
2015 Financial Highlights
(a) Percentage changes are based on unrounded amounts.
(b) Excludes the net mark-to-market impact of our commodity hedges, restructuring and impairment charges and pension-related settlements in both
years. In 2015, also excludes a charge related to Tingyi and the Venezuela impairment charges. In2014, also excludes a charge related to the Venezuela
remeasurement. See page 143 “Reconciliation of GAAP and Non-GAAP Information” for a reconciliation to the most directly comparable nancial measure
in accordance with GAAP.
(c) Excludes the net mark-to-market impact of our commodity hedges, restructuring and impairment charges and pension-related settlements in both
years. In 2015, also excludes a charge related to Tingyi, Venezuela impairment charges and a non-cash tax bene t. In 2014, also excludes a charge related
to the Venezuela remeasurement. See page 58 “Results of Operations — Consolidated Review — Other Consolidated Results” in Management’s Discussion
and Analysis, and page 143 “Reconciliation of GAAP and Non-GAAP Information” for a reconciliation to the most directly comparable nancial measure in
accordance with GAAP.
(d) Includes the impact of net capital spending, and excludes payments related to restructuring charges (after-tax) in both years. In 2015, also excludes
pension-related settlements (after-tax). In 2014, also excludes discretionary pension and retiree medical contributions (after-tax) and net capital
investments related to restructuring plan. See pages 70–71 “Our Liquidity and Capital Resources” in Management’s Discussion and Analysis for a
reconciliation to the most directly comparable nancial measure in accordance with GAAP.
PepsiCo, Inc. and Subsidiaries
(in millions except per share data; all per share amounts assume dilution)
Summary of Operations 2015 2014 % Chg (a)
Net revenue $63,056 $66,683 −5%Net revenue $63,056 $66,683 −5%
Core total operating profit Core total operating profit (b)(b) $ 9,937 $10,313 −4% $ 9,937 $10,313 −4%
Core earnings per share attributable to PepsiCo Core earnings per share attributable to PepsiCo (c)(c) $ 4.57 $ 4.63 −1% $ 4.57 $ 4.63 −1%
Free cash flow, excluding certain items Free cash flow, excluding certain items (d)(d) $ 8,128 $ 8,259 −2% $ 8,128 $ 8,259 −2%
Capital spending $ 2,758 $ 2,859 −3.5%Capital spending $ 2,758 $ 2,859 −3.5%
Common share repurchases $ 5,000 $ 5,012 —%Common share repurchases $ 5,000 $ 5,012 —%
Dividends paid $ 4,040 $ 3,730 8%Dividends paid $ 4,040 $ 3,730 8%
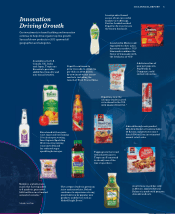
Net Revenues
Latin America 13%
Asia, Middle East & North Africa 10%
North America Beverages 33%
Frito-Lay North America 23%
Europe Sub-Saharan Africa 17%
Quaker Foods North America 4%
Division Operating Profi t
Asia, Middle East & North Africa 10%
Quaker Foods North America 6%
Frito-Lay North America 46%
North America Beverages 29%
Europe Sub-Saharan Africa 11%
Latin America −2%
Mix of Net Revenue
Food 53%
Beverage 47%
U.S. 56%
Outside U.S. 44%
10 PEPSICO