Pepsi 2015 Annual Report Download
Download and view the complete annual report
Please find the complete 2015 Pepsi annual report below. You can navigate through the pages in the report by either clicking on the pages listed below, or by using the keyword search tool below to find specific information within the annual report.-
 1
1 -
 2
2 -
 3
3 -
 4
4 -
 5
5 -
 6
6 -
 7
7 -
 8
8 -
 9
9 -
 10
10 -
 11
11 -
 12
12 -
13
-
14
-
15
-
16
-
17
-
18
-
19
-
20
-
21
-
22
-
23
-
24
-
25
-
26
-
27
-
28
-
29
-
30
-
31
-
32
-
33
-
34
-
35
-
36
-
37
-
38
-
39
-
40
-
41
-
42
-
43
-
44
-
45
-
46
-
47
-
48
-
49
-
50
-
51
-
52
-
53
-
54
-
55
-
56
-
57
-
58
-
59
-
60
-
61
-
62
-
63
-
64
-
65
-
66
-
67
-
68
-
69
-
70
-
71
-
72
-
73
-
74
-
75
-
76
-
77
-
78
-
79
-
80
-
81
-
82
-
83
-
84
-
85
-
86
-
87
-
88
-
89
-
90
-
91
-
92
-
93
-
94
-
95
-
96
-
97
-
98
-
99
-
100
-
101
-
102
-
103
-
104
-
105
-
106
-
107
-
108
-
109
-
110
-
111
-
112
-
113
-
114
-
115
-
116
-
117
-
118
-
119
-
120
-
121
-
122
-
123
-
124
-
125
-
126
-
127
-
128
-
129
-
130
-
131
-
132
-
133
-
134
-
135
-
136
-
137
-
138
-
139
-
140
-
141
-
142
-
143
-
144
-
145
-
146
-
147
-
148
-
149
-
150
-
151
-
152
-
153
-
154
-
155
-
156
-
157
-
158
-
159
-
160
-
161
-
162
-
163
-
164
-
165
-
166
-
167
-
168
 |
 |
I 2015 Annual Report I Performance with Purpose
Table of contents
-
Page 1
I 2015 Annual Report I Performance with Purpose -
Page 2
2015 Performance Highlights $ free cash ï¬,ow, excluding certain items1 8.1B BPS 1 organic revenue growth 5% 1 core constant currency earnings per share growth1 10% 140 $ core gross margin improvement returned to our shareholders through share repurchases and dividends 9B 210 BPS ... -
Page 3
...-year financial targets and continuing our multiyear track record of success.1 • Organic revenue grew 5% in 2015, capping a three-year period of consistent mid-single-digit organic revenue growth - in line with our long-term objectives. • Core gross margin improved by 140 basis points in 2015... -
Page 4
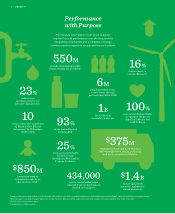
... (2008-2014) 10 consecutive years named one of World's Most Ethical Companies® by Ethisphere (2007-2016) 1B 93% of our waste diverted from landï¬ ll liter reduction in absolute water use 100% score on the Human Rights Campaign's Corporate Equality Index for our LGBT efforts 25% increase in... -
Page 5
... manage costs and margins in the shortrun while reinvesting in our business to drive growth over the long term. Importantly, these investments are fueling organic revenue growth. 2015 marked the third consecutive year innovation accounted for at least 8% of our net revenue. Such a strong performance... -
Page 6
... manufacturers combined. Our U.S. beverage business had a particularly 2. Based in part on data reported by Information Resources, Inc. through its Syndicated Advantage Service for the Total U.S. Multi- Outlet Plus Convenience for the 52-week period ending December 27, 2015, using PepsiCo's custom... -
Page 7
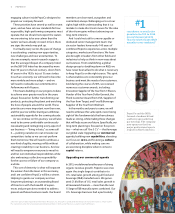
2015 ANNUAL REPORT 5 Innovation Driving Growth Our investments in brand building and innovation continue to help drive organic top line growth. Successful new products in 2015 spanned all geographies and categories. A new product based on one of our successful foodservice offerings, Doritos ... -
Page 8
... packaging, promotions and activations as part of the brand's global summer campaign. Doritos launched the 10th and ï¬nal year of the brand's "Crash the Super Bowl" program, which generated nearly 4,500 submissions from 28 countries. A Quaker YouTube video in Canada went viral, drawing nearly 13... -
Page 9
...to scale the brand in the Middle East and AsiaPacific, meeting the needs of consumers who are looking for more nutritious choices. In China, we capitalized on our strengths across categories to create a breakthrough new product - Quaker High Fiber Oats Dairy Drink - that combines oats and dairy into... -
Page 10
...ourselves to that standard. That means reinvesting in our business, paying dividends to shareholders, strengthening our market positions through acquisitions and returning residual cash to shareholders through share repurchases. In fact, over the past 10 years, we have returned more than $35 billion... -
Page 11
... of the cola nut. Its ï¬,agship location will open in 2016 in New York City's Meatpacking District, and the experience will be replicated at popculture events throughout the year. Designing New Consumer Experiences Investments to build industry-leading Design and Research & Development capabilities... -
Page 12
...dilution) Summary of Operations Net revenue Core total operating profit (b) Core earnings per share attributable to PepsiCo Free cash flow, excluding certain items Capital spending Common share repurchases Dividends paid (d) (c) 2015 $63,056 $ 9,937 $ 4.57 $ 8,128 $ 2,758 $ 5,000 $ 4,040 2014 $66... -
Page 13
2015 ANNUAL REPORT 11 PepsiCo Board of Directors Shown in photo, left to right: Cesar Conde Chairman, NBCUniversal International Group and NBCUniversal Telemundo Enterprises 42. Elected 2016. Robert C. Pohlad President, Dakota Holdings, LLC 61. Elected 2015. Richard W. Fisher Former President ... -
Page 14
... Asia, Middle East and North Africa Indra K. Nooyi Chairman of the Board and Chief Executive Officer Albert P. Carey Chief Executive Officer, North America Beverages Hugh F. Johnston Vice Chairman, Executive Vice President and Chief Financial Officer Laxman Narasimhan Chief Executive Officer, Latin... -
Page 15
PepsiCo, Inc. Annual Report on Form 10-K For the fiscal year ended December 26, 2015 -
Page 16
page intentionally left blank -
Page 17
... 12, 2015, the last day of business of our most recently completed second fiscal quarter, was $137.9 billion (based on the closing sale price of PepsiCo, Inc.'s Common Stock on that date as reported on the New York Stock Exchange). The number of shares of PepsiCo, Inc. Common Stock outstanding as of... -
Page 18
... 26 27 27 PART II Item 5. Market for Registrant's Common Equity, Related Stockholder Matters and Issuer Purchases of Equity Securities Item 6. Selected Financial Data Item 7. Management's Discussion and Analysis of Financial Condition and Results of Operations Item 7A. Quantitative and Qualitative... -
Page 19
... are a leading global food and beverage company with a complementary portfolio of enjoyable brands, including FritoLay, Gatorade, Pepsi-Cola, Quaker and Tropicana. Through our operations, authorized bottlers, contract manufacturers and other third parties, we make, market, distribute and sell a wide... -
Page 20
... 2015, 2014 and 2013, respectively, and approximated 33% of our total net revenue in 2015 and 30% of our total net revenue in both 2014 and 2013. Latin America Either independently or in conjunction with third parties, Latin America makes, markets, distributes and sells a number of snack food brands... -
Page 21
... total net revenue in 2013. Asia, Middle East and North Africa Either independently or in conjunction with third parties, AMENA makes, markets, distributes and sells a number of leading snack food brands including Lay's, Kurkure, Chipsy, Doritos, Cheetos and Crunchy through consolidated businesses... -
Page 22
... expanding it globally. See Note 10 to our consolidated financial statements for additional information on how we manage our exposure to commodity costs. Our Brands and Intellectual Property Rights We own numerous valuable trademarks which are essential to our worldwide businesses, including Agusha... -
Page 23
... our 2015 net revenue in North America, with Wal-Mart (including Sam's) representing approximately 18%. These percentages include concentrate sales to our independent bottlers, which were used in finished goods sold by them to these retailers. See Note 8 to our consolidated financial statements for... -
Page 24
... to Information Resources, Inc. However, The Coca-Cola Company has significant carbonated soft drink (CSD) share advantage in many markets outside the United States. Our beverage, food and snack products compete primarily on the basis of brand recognition, taste, price, quality, product variety... -
Page 25
... to use renewable resources; and efforts to optimize package technology and design to make our packaging increasingly sustainable with lower environmental impact. Research and development costs were $754 million, $718 million and $665 million in 2015, 2014 and 2013, respectively, and are reported... -
Page 26
... may negatively affect our business and operations or damage our reputation." The Iran Threat Reduction and Syria Human Rights Act of 2012 (ITRA) requires disclosure of certain activities relating to Iran by PepsiCo or its affiliates that occurred during our 2015 fiscal year. As previously disclosed... -
Page 27
... on satisfactory terms when they expire. We believe that relations with our employees are generally good. Available Information We are required to file annual, quarterly and current reports, proxy statements and other information with the U.S. Securities and Exchange Commission (SEC). The public may... -
Page 28
... our business, financial condition or results of operations. We are a global food and beverage company operating in highly competitive categories and markets and we rely on continued demand for our products. To generate revenues and profits, we must sell products that appeal to our customers and... -
Page 29
... of social media and online advertising campaigns and marketing programs. Although we devote significant resources to the items mentioned above, there can be no assurance as to our continued ability to develop, launch and maintain successful new products or variants of existing products in a timely... -
Page 30
... requirements, and competing regulations and standards, where our products are made, manufactured, distributed or sold, may result in higher compliance costs, capital expenditures and higher production costs, which could adversely affect our business, financial condition or results of operations. In... -
Page 31
...of operations. Our business, financial condition or results of operations could suffer if we are unable to compete effectively. Our beverage, food and snack products are in highly competitive categories and markets and compete against products of international beverage, food and snack companies that... -
Page 32
... unable to compete effectively, we may be unable to grow or maintain sales, gross margins or category share in the global market or in various local markets or we may need to increase capital, marketing or other expenditures, which may adversely affect our business, financial condition or results... -
Page 33
... assets that could increase future employee benefit costs and/or funding requirements of our pension or post-retirement plans. In addition, we cannot predict how current or future economic conditions will affect our customers, consumers, suppliers, bottlers, distributors, joint venture partners... -
Page 34
... making, innovation and brand management across the global PepsiCo organization to enable us to compete effectively. Further, in order to capitalize on our cost reduction efforts and our global operating model, it will be necessary to make certain investments in our business, which may be limited... -
Page 35
... our business, financial condition or results of operations. We are a leading global beverage, food and snack company with brands that are respected household names throughout the world. Maintaining a good reputation globally is critical to selling our branded products. Our reputation or brand image... -
Page 36
...litigation, loss of sales or other consequences, which may cause us to suffer damage to our reputation in the United States or abroad. Failure to comply with local laws and regulations, to maintain an effective system of internal controls or to provide accurate and timely financial information could... -
Page 37
... manufacturing, distribution, sales, accounting, financial reporting and administrative support activities and information technology systems with our company; our ability to successfully operate in new categories or territories; motivating, recruiting and retaining executives and key employees... -
Page 38
... or our failure to develop an adequate succession plan to backfill current leadership positions, including the Chief Executive Officer, or to hire and retain a diverse workforce could deplete our institutional knowledge base and erode our competitive advantage or result in increased costs due to... -
Page 39
... material adverse effect on our business, financial condition or results of operations. If we do not allocate and effectively manage the resources necessary to build and maintain our information technology infrastructure, including monitoring networks and systems, upgrading our security policies and... -
Page 40
... loss of customers or consumers and revenue. Fluctuations in exchange rates impact our business, financial condition and results of operations. We hold assets, incur liabilities, earn revenues and pay expenses in a variety of currencies other than the U.S. dollar. Because our consolidated financial... -
Page 41
... impair manufacturing and distribution of our products or result in a loss of sales, which could adversely impact our business, financial condition or results of operations. The terms and conditions of existing, renegotiated or new collective bargaining agreements could also increase our costs or... -
Page 42
... significant expense and devote significant resources, and may generate adverse publicity that may damage our reputation or brand image, which could have an adverse impact on our business, financial condition or results of operations. Many factors may adversely affect the price of our common stock... -
Page 43
... 20 offices support shared functions. (e) Includes manufacturing and processing plants as well as bottling and production plants. (f) Includes warehouses, distribution centers, offices, including division headquarters, research and development facilities and other facilities. Significant properties... -
Page 44
... cannot be predicted with certainty, management believes that the final outcome of the foregoing will not have a material adverse effect on our consolidated financial statements, results of operations or cash flows. See also "Item 1. Business - Regulatory Environment and Environmental Compliance... -
Page 45
... Officer, Global Research and Development Chief Executive Officer, Europe Sub-Saharan Africa Chief Executive Officer, Latin America Chairman of the Board of Directors and Chief Executive Officer, PepsiCo Executive Vice President, Human Resources and Chief Human Resources Officer, PepsiCo Executive... -
Page 46
...in July 2015 and Executive Vice President and Chief Financial Officer, PepsiCo in March 2010. Mr. Johnston assumed responsibility for the Company's global e-commerce business and Quaker Foods North America division in December 2014 and the Company's global business and information solutions function... -
Page 47
... also Vice President and Director of Corporate Strategy and Planning at Motorola, Inc. Ms. Nooyi has served as a director of Schlumberger Ltd. since April 2015. Cynthia M. Trudell, 62, has been Executive Vice President, Human Resources and Chief Human Resources Officer, PepsiCo since April 2011 and... -
Page 48
... sales prices for PepsiCo common stock as reported on the New York Stock Exchange for each fiscal quarter of 2015 and 2014 are contained in "Item 6. Selected Financial Data." Shareholders - As of February 4, 2016, there were approximately 131,285 shareholders of record of our common stock. Dividends... -
Page 49
... the fourth quarter of 2015, we completed repurchases of the remaining $79 million of shares available under the $10 billion repurchase program authorized by our Board of Directors and publicly announced on February 14, 2013, which commenced on July 1, 2013 and would have expired on June 30, 2016... -
Page 50
...with our merger with The Quaker Oats Company (Quaker) in 2001, shares of our convertible preferred stock were authorized and issued to an employee stock ownership plan (ESOP) fund established by Quaker. The preferences, limitations and relative rights of the shares of convertible preferred stock are... -
Page 51
... reporting weeks. Net revenue Net income attributable to PepsiCo (a) Net income attributable to PepsiCo per common share - basic (a) Net income attributable to PepsiCo per common share - diluted (a) Cash dividends declared per common share Total assets (a) Long-term debt Return on invested capital... -
Page 52
...-tax or $0.17 per share) related to our acquisitions of The Pepsi Bottling Group, Inc. (PBG), PepsiAmericas, Inc. (PAS) and WBD. The 2011 fiscal year consisted of fifty-three weeks compared to fifty-two weeks in our normal fiscal year. The 53rd week increased 2011 net revenue by $623 million and... -
Page 53
...44 million after-tax or $0.03 per share) of mark-to-market net losses, respectively, on commodity hedges in corporate unallocated expenses. (b) In 2015 and 2014, restructuring and impairment charges related to the 2014 and 2012 Multi-Year Productivity Plans were $230 million ($184 million after-tax... -
Page 54
...a pre-tax gain of $31 million ($34 million after-tax or $0.02 per share) in the ESSA segment associated with the sale of agricultural assets in Russia. (m) Reflects the quarterly composite high and low sales prices for one share of PepsiCo common stock as reported on the New York Stock Exchange. 37 -
Page 55
... and Retiree Medical Plans OUR FINANCIAL RESULTS Items Affecting Comparability Results of Operations - Consolidated Review Results of Operations - Division Review Frito-Lay North America Quaker Foods North America North America Beverages Latin America Europe Sub-Saharan Africa Asia, Middle East and... -
Page 56
... Note 4 - Property, Plant and Equipment and Intangible Assets Note 5 - Income Taxes Note 6 - Share-Based Compensation Note 7 - Pension, Retiree Medical and Savings Plans Note 8 - Related Party Transactions Note 9 - Debt Obligations and Commitments Note 10 - Financial Instruments Note 11 - Net Income... -
Page 57
...to Information Resources, Inc. Since 2012, we have increased spending as a percent of net revenue on both advertising and marketing and research and development, illustrating our ability to manage costs and margins in the short run while reinvesting in our business to drive growth over the long term... -
Page 58
..., added sugars and saturated fat in many of our products while continuing to invest in growing our nutrition businesses. We are also focused on developing new ways to reach our consumers through innovative digital marketing, social media engagement and content creation. In addition, as the global... -
Page 59
... our beverage, food and snack businesses in Asia, Middle East and North Africa. See "Item 1. Business." for more information on our divisions and a description of our distribution network, ingredients and other supplies, brands and intellectual property rights, seasonality, customers and competition... -
Page 60
... • The PepsiCo Risk Committee (PRC), which is comprised of a cross-functional, geographically diverse, senior management group, including PepsiCo's Chairman of the Board and Chief Executive Officer, meets regularly to identify, assess, prioritize and address our top strategic, financial, operating... -
Page 61
... to our consolidated financial statements for further discussion of these derivatives and our hedging policies. See "Our Critical Accounting Policies" for a discussion of the exposure of our pension and retiree medical plan assets and liabilities to risks related to market fluctuations. Inflationary... -
Page 62
... in Russia closely. For the years ended December 26, 2015 and December 27, 2014, total net revenue generated by our operations in Russia represented 4% and 7% of our consolidated net revenue, respectively. As of December 26, 2015, our long-lived assets in Russia were $3.6 billion. Our operations in... -
Page 63
...have discussed these policies with our Audit Committee. Our critical accounting policies are revenue recognition; goodwill and other intangible assets; income tax expense and accruals; and pension and retiree medical plans. Revenue Recognition Our products are sold for cash or on credit terms. Our... -
Page 64
..., the aging of accounts receivable and our analysis of customer data. Bad debt expense is classified within selling, general and administrative expenses in our income statement. Goodwill and Other Intangible Assets We sell products under a number of brand names, many of which were developed by us... -
Page 65
...including future cash flows or income consistent with management's strategic business plans, annual sales growth rates, perpetuity growth assumptions and the selection of assumptions underlying a discount rate (weighted-average cost of capital) based on market data available at the time. Significant... -
Page 66
... of the cost. In addition, the Company has been phasing out certain Company subsidies of retiree medical benefits. In the fourth quarter of 2014, the Company offered certain former employees who had vested benefits in our U.S. defined benefit pension plans the option of receiving a one-time lump sum... -
Page 67
... benefit obligation at December 27, 2014. See Note 7 to our consolidated financial statements for information about the expected return on plan assets and our plan investment strategy. The health care trend rate used to determine our retiree medical plan's liability and expense is reviewed annually... -
Page 68
...-average assumptions for pension and retiree medical expense are as follows: 2016 Pension Expense discount rate Expected rate of return on plan assets Expected rate of salary increases Retiree medical Expense discount rate Expected rate of return on plan assets Current health care cost trend rate... -
Page 69
...unallocated expenses. In 2015, we recognized $11 million ($8 million after-tax with a nominal amount per share) of mark-to-market net gains on commodity hedges in corporate unallocated expenses, with an $18 million net loss recognized in cost of sales and a $29 million net gain recognized in selling... -
Page 70
... net loss recognized in cost of sales and a $10 million net gain recognized in selling, general and administrative expenses. See Note 1 to our consolidated financial statements for further information. Restructuring and Impairment Charges 2014 Multi-Year Productivity Plan In 2015, 2014 and 2013... -
Page 71
... 2012 Productivity Plan, summarized by period as follows: Charges 2011 2012 2013 2014 2015 2016 - 2017 (expected) $ $ 383 279 110 61 61 - 894 (a) Cash Expenditures $ 30 343 133 101 49 $ 38 694 (b) (a) This total pre-tax charge consisted of $560 million of severance and other employee-related costs... -
Page 72
... Cash Flow" and "Net Return on Invested Capital." Results of Operations - Consolidated Review In the discussions of net revenue and operating profit below, "effective net pricing" reflects the year-overyear impact of discrete pricing actions, sales incentive activities and mix resulting from selling... -
Page 73
... of our beverage products at the consumer level. Sales of products from our unconsolidated joint ventures are reflected in our reported volume. NAB, Latin America, ESSA and AMENA, either independently or in conjunction with third parties, make, market, distribute and sell ready-to-drink tea products... -
Page 74
...by increased research and development costs and charges associated with productivity initiatives outside the scope of the 2014 and 2012 Productivity Plans. 2014 On a reported basis, total operating profit decreased 1% and operating margin decreased 0.2 percentage points. Operating profit performance... -
Page 75
... $ (1)% 11 6% 3 10 % 9% 2015 Net interest expense increased $87 million, reflecting higher rates on our debt balances and lower gains on the market value of investments used to economically hedge a portion of our deferred compensation costs. The reported tax rate increased 1.0 percentage point... -
Page 76
...$ 20,618 $ 20,171 Latin America $ 8,228 $ 9,425 ESSA $ 10,510 $ 13,399 AMENA $ 6,375 $ 6,618 Total $ 63,056 $ 66,683 Net Revenue, 2014 Net Revenue, 2013 % Impact of: Volume(a) Effective net pricing Foreign exchange translation Acquisitions and divestitures Reported growth(d) (b) FLNA $ 14,502 $ 14... -
Page 77
... foreign exchange translation from reported net revenue growth. See also "Non-GAAP Measures." 2015 Reported Growth % Impact of: Foreign exchange translation Acquisitions and divestitures Venezuela deconsolidation(a) Organic Growth(b) 1 - - 3% 2 - - 1 % 1 - - 3% 27 - 6 20 % Latin America 1 % 9 - 10... -
Page 78
... operating cost increases, including strategic initiatives, as well as higher advertising and marketing expenses. 2014 Net revenue grew 3% and volume grew 2%. Net revenue growth was driven by the volume growth and effective net pricing. The volume growth reflects mid-single-digit growth in trademark... -
Page 79
... by planned cost reductions across a number of expense categories, favorable mix and the volume growth, as well as lower commodity costs, which positively contributed 3 percentage points to operating profit performance. 2014 Net revenue declined 2% and volume was even with the prior year. The net... -
Page 80
... prior year. Operating profit performance reflected certain operating cost increases, mostly offset by the favorable effective net pricing, planned cost reductions across a number of expense categories, as well as lower commodity costs, which positively impacted reported operating profit performance... -
Page 81
... the 2014 and 2012 Productivity Plans negatively impacted reported operating profit performance by 2 percentage points. These impacts were partially offset by the effective net pricing, planned cost reductions across a number of expense categories and the volume growth. Unfavorable foreign exchange... -
Page 82
.... The beverage volume growth included a 2percentage-point contribution from certain of our bottler's brands relating to a new joint venture in Chile. Operating profit increased 1%, primarily reflecting the effective net pricing and planned cost reductions across a number of expense categories... -
Page 83
... by the effective net pricing and planned cost reductions across a number of expense categories, as well as lower charges in the current year associated with productivity initiatives outside the scope of the 2014 and 2012 Productivity Plans, which positively impacted operating profit performance by... -
Page 84
... volume growth, planned cost reductions across a number of expense categories and the effective net pricing. In addition, lower commodity costs positively contributed 6 percentage points to reported operating profit performance. These impacts were partially offset by certain operating cost increases... -
Page 85
... were partially offset by the net revenue growth and planned cost reductions across a number of expense categories. The lapping of incremental investments into our business in the prior year, which positively contributed 4 percentage points to operating profit performance, was partially offset by... -
Page 86
... matters related to open tax years. See Note 5 to our consolidated financial statements. This impact was partially offset by the discretionary pension and retiree medical contributions described above. Also see "Free Cash Flow" below for certain other items impacting net cash provided by operating... -
Page 87
... from long-term debt of $1.7 billion and proceeds from exercises of stock options of $0.8 billion. We annually review our capital structure with our Board of Directors, including our dividend policy and share repurchase activity. On February 11, 2015, we announced a new share repurchase program... -
Page 88
...to our consolidated financial statements. Net Return on Invested Capital ROIC is a metric management uses to monitor the profitability of our utilized capital. We believe this metric balances our operating results with asset and liability management, and may contribute to long-term shareholder value... -
Page 89
... excluding items affecting comparability, by using net income attributable to PepsiCo, excluding items affecting comparability, plus after-tax interest expense, divided by a quarterly average of invested capital less cash, cash equivalents and short-term investments adjusted for these items. 2015 13... -
Page 90
... interests Net Income Attributable to PepsiCo Net Income Attributable to PepsiCo per Common Share Basic Diluted Weighted-average common shares outstanding Basic Diluted Cash dividends declared per common share See accompanying notes to the consolidated financial statements. $ $ $ $ $ 73 -
Page 91
... Cash flow hedges: Reclassification of net losses to net income Net derivative losses Pension and retiree medical: Reclassification of net losses to net income Remeasurement of net liabilities and translation Unrealized losses on securities Other Total Other Comprehensive Loss Comprehensive income... -
Page 92
... of Contents Consolidated Statement of Cash Flows PepsiCo, Inc. and Subsidiaries Fiscal years ended December 26, 2015, December 27, 2014 and December 28, 2013 (in millions) 2015 Operating Activities Net income Depreciation and amortization Share-based compensation expense Merger and integration... -
Page 93
... Contents Consolidated Statement of Cash Flows (continued) PepsiCo, Inc. and Subsidiaries Fiscal years ended December 26, 2015, December 27, 2014 and December 28, 2013 (in millions) 2015 Financing Activities Proceeds from issuances of long-term debt Payments of long-term debt Short-term borrowings... -
Page 94
... 2014 (in millions except per share amounts) 2015 ASSETS Current Assets Cash and cash equivalents Short-term investments Accounts and notes receivable, net Inventories Prepaid expenses and other current assets Total Current Assets Property, Plant and Equipment, net Amortizable Intangible Assets, net... -
Page 95
... Stock Balance, beginning of year Share repurchases Stock option exercises, RSUs, PSUs and PEPunits converted Other Balance, end of year Total PepsiCo Common Shareholders' Equity Noncontrolling Interests Balance, beginning of year Net income attributable to noncontrolling interests Distributions... -
Page 96
...revenues, expenses and disclosure of contingent assets and liabilities. Estimates are used in determining, among other items, sales incentives accruals, tax reserves, share-based compensation, pension and retiree medical accruals, amounts and useful lives for intangible assets, and future cash flows... -
Page 97
... 200 countries and territories with our largest operations in North America, Mexico, Russia, the United Kingdom and Brazil. Division results are based on how our Chief Executive Officer assesses the performance of and allocates resources to our divisions and are considered our reportable segments... -
Page 98
...loss for Latin America for the year ended December 26, 2015 includes a pre- and after-tax charge of $1.4 billion related to our change in accounting for our investments in our wholly-owned Venezuelan subsidiaries and beverage joint venture. See subsequent "Venezuela" discussion. (e) Operating profit... -
Page 99
.... (b) Corporate assets consist principally of certain cash and cash equivalents, short-term investments, derivative instruments, property, plant and equipment and pension and tax assets. In 2015, the change in total Corporate assets was primarily due to the increase in cash and cash equivalents... -
Page 100
...(a) Long-lived assets represent property, plant and equipment, nonamortizable intangible assets, amortizable intangible assets and investments in noncontrolled affiliates. These assets are reported in the country where they are primarily used. (b) Change in net revenue and long-lived assets in 2015... -
Page 101
... August, were included in our Consolidated Statement of Income using a combination of the fixed exchange and SICAD rates, as appropriate. As of the end of 2015, consistent with the end of the third quarter of 2015, we did not consolidate the assets and liabilities of our Venezuelan subsidiaries in... -
Page 102
... on our sales incentives, see "Our Critical Accounting Policies" in Management's Discussion and Analysis of Financial Condition and Results of Operations. Advertising and other marketing activities, reported as selling, general and administrative expenses, totaled $3.9 billion in 2015, 2014 and 2013... -
Page 103
... on a straight-line basis when placed into service over the estimated useful lives of the software, which approximate 5 to 10 years. Software amortization totaled $202 million in 2015, $208 million in 2014 and $197 million in 2013. Net capitalized software and development costs were $863 million and... -
Page 104
... and consolidation. Property, Plant and Equipment and Intangible Assets - Note 4. Income Taxes - Note 5, and for additional unaudited information see, "Our Critical Accounting Policies" in Management's Discussion and Analysis of Financial Condition and Results of Operations. Share-Based Compensation... -
Page 105
...our go-to-market systems in developed markets; expanding shared services; and implementing simplified organization structures to drive efficiency. The 2014 Productivity Plan is in addition to the 2012 Productivity Plan and is expected to continue the benefits of that plan. In 2015, 2014 and 2013, we... -
Page 106
...2012 Multi-Year Productivity Plan The 2012 Productivity Plan included actions in every aspect of our business that we believe would strengthen our complementary food, snack and beverage businesses by: leveraging new technologies and processes across PepsiCo's operations, go-to-market and information... -
Page 107
...A summary of our 2012 Productivity Plan charges is as follows: 2015 Severance and Other Employee Costs FLNA (a) QFNA NAB (a) Latin America (a) ESSA AMENA Corporate (a) $ $ - - - 6 15 15 3 39 $ Severance and Other Employee Costs $ 2014 Severance and Other Employee Costs $ 4 - 8 5 36 21 - $ 74 $ 2013... -
Page 108
...472 2015 2014 2013 Property, plant and equipment is recorded at historical cost. Depreciation and amortization are recognized on a straight-line basis over an asset's estimated useful life. Land is not depreciated and construction in progress is not depreciated until ready for service. A summary... -
Page 109
... and acquired franchise rights if future revenues and their contribution to the operating results of NAB's CSD business do not achieve our estimated future cash flows or if macroeconomic conditions result in a future increase in the weighted-average cost of capital used to estimate fair value... -
Page 110
... Brands Latin America (a) Goodwill Brands ESSA (b) Goodwill Reacquired franchise rights Acquired franchise rights Brands AMENA Goodwill Brands $ 305 29 334 175 Translation and Other $ (14) $ (2) (16) - Balance, End of 2014 291 27 318 175 Translation and Other $ (24) $ (5) (29) - Balance, End of 2015... -
Page 111
... U.S. Federal statutory tax rate to our annual tax rate is as follows: 2015 35.0% 0.6 (10.5) 6.4 (3.1) (2.3) 26.1% 2014 35.0% 0.6 (8.6) - - (1.9) 25.1% 2013 35.0% 1.2 (8.8) - (2.4) (1.3) 23.7% U.S. Federal statutory tax rate State income tax, net of U.S. Federal tax benefit Lower taxes on foreign... -
Page 112
...wholly-owned subsidiary Property, plant and equipment Intangible assets other than nondeductible goodwill Other Gross deferred tax liabilities Deferred tax assets Net carryforwards Share-based compensation Retiree medical benefits Other employee-related benefits Pension benefits Deductible state tax... -
Page 113
...see "Other Consolidated Results" in Management's Discussion and Analysis of Financial Condition and Results of Operations. In the fourth quarter of 2015, we reached an agreement with the IRS resolving substantially all open matters related to the audits of taxable years 2010 and 2011 (two immaterial... -
Page 114
...that adjusts based upon changes in PepsiCo's absolute stock price as well as PepsiCo's Total Shareholder Return relative to the S&P 500 over a three-year performance period. The Company may use authorized and unissued shares to meet share requirements resulting from the exercise of stock options and... -
Page 115
...million of total unrecognized compensation cost related to nonvested share-based compensation grants. This unrecognized compensation cost is expected to be recognized over a weighted-average period of two years. Method of Accounting and Our Assumptions We account for our employee stock options under... -
Page 116
... the expected life. Dividend yield is estimated over the expected life based on our stated dividend policy and forecasts of net income, share repurchases and stock price. A summary of our share-based compensation activity for the year ended December 26, 2015 is as follows: Our Stock Option Activity... -
Page 117
... the performance period has not ended as of December 26, 2015, at the threshold, target and maximum award levels were zero, 0.8 million and 1.4 million, respectively. Other Share-Based Compensation Data 2015 Stock Options Total number of options granted (a) Weighted-average grant-date fair value... -
Page 118
... for pension expense and approximately 8 years for retiree medical expense. The cost or benefit of plan changes that increase or decrease benefits for prior employee service (prior service cost/(credit)) is included in earnings on a straight-line basis over the average remaining service period of... -
Page 119
... Selected financial information for our pension and retiree medical plans is as follows: Pension U.S. 2015 Change in projected benefit liability Liability at beginning of year Service cost Interest cost Plan amendments Participant contributions Experience (gain)/loss Benefit payments Settlement... -
Page 120
... of benefit expense Service cost Interest cost Expected return on plan assets Amortization of prior service (credit)/cost Amortization of net loss/(gain) Settlement/curtailment loss/(gain) (a) Special termination benefits Total 2014 2013 International 2015 2014 2013 2015 2014 2013 Retiree Medical... -
Page 121
...average assumptions used to determine projected benefit liability and benefit expense for our pension and retiree medical plans: Pension U.S. 2015 Weighted-average assumptions Liability discount rate Expense discount rate Expected return on plan assets Liability rate of salary increases Expense rate... -
Page 122
...retiree medical benefits. Plan Assets Our pension plan investment strategy includes the use of actively managed accounts and is reviewed periodically in conjunction with plan liabilities, an evaluation of market conditions, tolerance for risk and cash requirements for benefit payments. This strategy... -
Page 123
... and 2014 amounts include $354 million and $415 million, respectively, of retiree medical plan assets that are restricted for purposes of providing health benefits for U.S. retirees and their beneficiaries. Based on quoted market prices in active markets. Based on the fair value of the investments... -
Page 124
...and Sales, Net $ 18 $ - 18 Balance, End of 2014 $ 721 $ 42 763 Contracts with insurance companies Total $ Balance, End of 2015 $ 835 39 $ 874 Retiree Medical Cost Trend Rates 2016 Average increase assumed Ultimate projected increase (a) 2015 6% 5% 6% 5% 2025 Year of ultimate projected increase... -
Page 125
... of business and are consistent with terms negotiated with other vendors and customers. In addition, certain of our employees serve on the boards of Pepsi Bottling Ventures LLC and other affiliated companies of PepsiCo and do not receive incremental compensation for such services. Note 9 - Debt... -
Page 126
... proceeds from issuances of long-term debt excluding debt issuance costs and discounts. The net proceeds from the issuances of the above notes were used for general corporate purposes, including the repayment of commercial paper. In 2015, we entered into a new five-year unsecured revolving credit... -
Page 127
... and orange juice. Non-cancelable marketing commitments are primarily for sports marketing. Bottler funding to independent bottlers is not reflected in our long-term contractual commitments as it is negotiated on an annual basis. Accrued liabilities for pension and retiree medical plans are not... -
Page 128
... Management's Discussion and Analysis of Financial Condition and Results of Operations for further unaudited information on our business risks. For cash flow hedges, the effective portion of changes in fair value is deferred in accumulated other comprehensive loss within common shareholders' equity... -
Page 129
...% of total debt, after the impact of the related interest rate derivative instruments, was exposed to variable rates, compared to approximately 25% as of December 27, 2014. Available-for-Sale Securities Investments in debt and marketable equity securities, other than investments accounted for under... -
Page 130
... "Items Affecting Comparability" in Management's Discussion and Analysis of Financial Condition and Results of Operations. The write-off of this call option did not impact the value of our 5% indirect equity interest in TAB, which was $538 million as of December 26, 2015. We continue to monitor the... -
Page 131
... values of our financial assets and liabilities as of December 26, 2015 and December 27, 2014 are categorized as follows: Assets(a) Available-for-sale securities: Equity securities (b) Debt securities (c) Short-term investments (d) Prepaid forward contracts (e) Deferred compensation (f) Derivatives... -
Page 132
... in either cost of sales or selling, general and administrative expenses, depending on the underlying commodity. Based on current market conditions, we expect to reclassify net gains of $33 million related to our cash flow hedges from accumulated other comprehensive loss into net income during the... -
Page 133
... 1,541 1,541 Net income attributable to PepsiCo Preferred shares: Dividends Redemption premium Net income available for PepsiCo common shareholders Basic net income attributable to PepsiCo per common share Net income available for PepsiCo common shareholders Dilutive securities: Stock options, RSUs... -
Page 134
... attributable to PepsiCo are as follows: 2015 Currency translation adjustment (a) (b) Cash flow hedges, net of tax Unamortized pension and retiree medical, net of tax Unrealized gain on securities, net of tax Other Accumulated other comprehensive loss attributable to PepsiCo $ (c) 2014 (8,255) $ 34... -
Page 135
...Loss 2015 2014 2013 Currency Translation: Venezuelan entities (Gains)/Losses on cash flow hedges: Foreign exchange contracts Foreign exchange contracts Interest rate derivatives Commodity contracts Commodity contracts Net losses before tax Tax amounts Net losses after tax Pension and retiree medical... -
Page 136
... information for accounts and notes receivable and inventories is summarized as follows: 2015 Accounts and notes receivable Trade receivables Other receivables Allowance, beginning of year Net amounts charged to expense Deductions (a) 2014 $ 5,817 971 6,788 145 38 (27) (19) 137 $ 6,651 $ $ 2013... -
Page 137
... of 2013, as part of the refranchising of our beverage business in Vietnam, we completed a transaction with Suntory Holdings Limited. Under the terms of the agreement, we sold a controlling interest in our Vietnam bottling operations. The alliance serves as the franchise bottler for both companies... -
Page 138
... for many years. The management of PepsiCo is responsible for the objectivity and integrity of our consolidated financial statements. The Audit Committee of the Board of Directors has engaged independent registered public accounting firm, KPMG LLP, to audit our consolidated financial statements, and... -
Page 139
... financial reporting. February 11, 2016 /s/ MARIE T. GALLAGHER Marie T. Gallagher Senior Vice President and Controller /s/ HUGH F. JOHNSTON Hugh F. Johnston Vice Chairman, Executive Vice President and Chief Financial Officer /s/ INDRA K. NOOYI Indra K. Nooyi Chairman of the Board of Directors and... -
Page 140
... 27, 2014, and the related Consolidated Statements of Income, Comprehensive Income, Cash Flows and Equity for each of the fiscal years in the three-year period ended December 26, 2015. We also have audited PepsiCo, Inc.'s internal control over financial reporting as of December 26, 2015, based on... -
Page 141
..., the consolidated financial statements referred to above present fairly, in all material respects, the financial position of PepsiCo, Inc. as of December 26, 2015 and December 27, 2014, and the results of its operations and its cash flows for each of the fiscal years in the three-year period ended... -
Page 142
...-over-year impact of discrete pricing actions, sales incentive activities and mix resulting from selling varying products in different package sizes and in different countries. Free cash flow: net cash provided by operating activities less capital spending plus sales of property, plant and equipment... -
Page 143
...: includes sales incentives and discounts offered through various programs to our customers, consumers or independent bottlers, as well as advertising and other marketing activities. Transaction gains and losses: the impact on our consolidated financial statements of exchange rate changes arising... -
Page 144
... of our management, including our Chief Executive Officer and Chief Financial Officer, we conducted an evaluation of the effectiveness of our internal control over financial reporting based upon criteria established in Internal Control - Integrated Framework (2013) by the Committee of Sponsoring... -
Page 145
... executive officers or senior financial officers will be posted on our website within the time period required by the SEC and New York Stock Exchange. Information about the procedures by which security holders may recommend nominees to our Board of Directors can be found in our 2016 Proxy Statement... -
Page 146
... the captions "Corporate Governance at PepsiCo - Related Person Transactions" and "Corporate Governance at PepsiCo - Director Independence" in our 2016 Proxy Statement and is incorporated herein by reference. Item 14. Principal Accounting Fees and Services. Information on our Audit Committee's pre... -
Page 147
... December 26, 2015 and December 27, 2014 Consolidated Statement of Equity - Fiscal years ended December 26, 2015, December 27, 2014 and December 28, 2013 Notes to Consolidated Financial Statements, and Report of Independent Registered Public Accounting Firm. (a)2. Financial Statement Schedules These... -
Page 148
...(d) of the Securities Exchange Act of 1934, PepsiCo has duly caused this report to be signed on its behalf by the undersigned, thereunto duly authorized. Dated: February 11, 2016 PepsiCo, Inc. By: /s/ Indra K. Nooyi Indra K. Nooyi Chairman of the Board of Directors and Chief Executive Officer 131 -
Page 149
... Board of Directors and Chief Executive Officer DATE February 11, 2016 Vice Chairman, Executive Vice President February 11, 2016 and Chief Financial Officer Senior Vice President and Controller (Principal Accounting Officer) Director Director Director Director Director Director Director Director... -
Page 150
... the rights of holders of long-term debt of PepsiCo, Inc. and all of its subsidiaries for which consolidated or unconsolidated financial statements are required to be filed with the Securities and Exchange Commission. Indenture dated May 21, 2007 between PepsiCo, Inc. and The Bank of New York Mellon... -
Page 151
...Notes due 2046, which is incorporated herein by reference to Exhibit 4.4 to PepsiCo, Inc.'s Current Report on Form 8-K filed with the Securities and Exchange Commission on October 14, 2015. Board of Directors Resolutions Authorizing PepsiCo, Inc.'s Officers to Establish the Terms of the 4.50% Senior... -
Page 152
...500% Senior Note due 2016, which is incorporated herein by reference to Exhibit 4.2 to PepsiCo, Inc.'s Current Report on Form 8-K filed with the Securities and Exchange Commission on May 6, 2011. Board of Directors Resolutions Authorizing PepsiCo, Inc.'s Officers to Establish the Terms of the 2.500... -
Page 153
...Inc.'s Current Report on Form 8-K filed with the Securities and Exchange Commission on July 30, 2013. First Supplemental Indenture, dated as of February 26, 2010, among Pepsi-Cola Metropolitan Bottling Company, Inc., The Pepsi Bottling Group, Inc., Bottling Group, LLC and The Bank of New York Mellon... -
Page 154
... PepsiCo, Inc. 1994 Long-Term Incentive Plan, as amended and restated, effective October 1, 1999, which is incorporated herein by reference to Exhibit 10.6 to PepsiCo, Inc.'s Annual Report on Form 10-K for the fiscal year ended December 25, 1999.* 10.2 PepsiCo Executive Income Deferral Program (Plan... -
Page 155
...the Quaker Long-Term Incentive Plan of 1990 and the PepsiCo, Inc. Director Stock Plan, effective as of November 17, 2006, which are incorporated herein by reference to Exhibit 10.31 to PepsiCo, Inc.'s Annual Report on Form 10-K for the fiscal year ended December 30, 2006.* 10.18 Form of Non-Employee... -
Page 156
...Long Term Incentive Plan, The Pepsi Bottling Group, Inc. 1999 Long Term Incentive Plan and PBG Stock Incentive Plan (effective February 8, 2007), which are incorporated herein by reference to Exhibit 99.7 to PepsiCo, Inc.'s Registration Statement on Form S-8 as filed with the Securities and Exchange... -
Page 157
... and restated effective as of January 1, 2010, which is incorporated herein by reference to Exhibit 10.68 to PepsiCo, Inc.'s Annual Report on Form 10-K for the fiscal year ended December 31, 2011.* 10.54 Amendment to the PepsiCo International Retirement Plan Defined Benefit Program, effective as of... -
Page 158
...-409A Program), generally effective as of January 1, 2013, which is incorporated herein by reference to Exhibit 10.77 to PepsiCo, Inc.'s Annual Report on Form 10-K for the fiscal year ended December 28, 2013.* 10.62 PepsiCo, Inc. 2007 Long-Term Incentive Plan, as amended and restated March 13, 2014... -
Page 159
... from PepsiCo, Inc.'s Annual Report on Form 10-K for the fiscal year ended December 26, 2015 formatted in XBRL (eXtensible Business Reporting Language): (i) the Consolidated Statement of Income, (ii) the Consolidated Statement of Comprehensive Income, (iii) the Consolidated Statement of Cash Flows... -
Page 160
page intentionally left blank -
Page 161
... organization structures, with wider spans of control and fewer layers of management. The 2012 Productivity Plan has enhanced PepsiCo's cost-competitiveness and provided a source of funding for future brand-building and innovation initiatives. Commodity Mark-To-Market Net Impact In the year ended... -
Page 162
...businesses. $124 million of the 2013 charge was recorded in corporate unallocated expenses, with the balance (equity income of $13 million) recorded in our Latin America segment. Core Net Return on Invested Capital Management uses ROIC to monitor the profitability of utilized capital and core net... -
Page 163
2015 ANNUAL REPORT 145 Return on Invested Capital (ROIC) Growth Reconciliation Year Ended 12/26/15 (13) bps Growth 2012-2015 (55) bps Reported ROIC Growth(b) Impact of: Cash, Cash Equivalents and Short-Term Investments Interest Income After Tax Commodity Mark-to-Market Net Impact Restructuring ... -
Page 164
... future operating performance, and statements addressing events and developments that we expect or anticipate will occur in the future, are forward-looking statements within the meaning of the Reform Act. These forward-looking statements are based on currently available information, operating plans... -
Page 165
...mail: [email protected] Year-End Market Price of Stock Based on calendar year-end (in $) 100 75 50 25 0 11 12 13 14 15 The closing price for a share of PepsiCo common stock on the New York Stock Exchange was the price as reported by Bloomberg for the years ending 2011-2015. Past performance is... -
Page 166
... of dividends, optional cash investments by electronic funds transfer or check drawn on a U.S. bank, sale of shares, online account access and electronic delivery of shareholder materials. Additional Information PepsiCo's Annual Report contains many of the valuable trademarks owned and/ or used by... -
Page 167
... annual retail sales in 2015 2015 Diversity Statistics % Women Board of Directors Senior Executives b Executives (U.S.) All Managers (U.S.) All Employees (U.S.) 29 27 32 34 18 % People of Colora 29 36 23 28 37 Contribution Summary (in millions) 2015 PepsiCo Foundation Corporate Contributions... -
Page 168