Omron 2007 Annual Report Download - page 8
Download and view the complete annual report
Please find page 8 of the 2007 Omron annual report below. You can navigate through the pages in the report by either clicking on the pages listed below, or by using the keyword search tool below to find specific information within the annual report.-
 1
1 -
 2
2 -
 3
3 -
 4
4 -
 5
5 -
 6
6 -
 7
7 -
 8
8 -
 9
9 -
 10
10 -
 11
11 -
 12
12 -
 13
13 -
 14
14 -
 15
15 -
 16
16 -
 17
17 -
 18
18 -
 19
19 -
20
-
21
-
22
-
23
-
24
-
25
-
26
-
27
-
28
-
29
-
30
-
31
-
32
-
33
-
34
-
35
-
36
-
37
-
38
-
39
-
40
-
41
-
42
-
43
-
44
-
45
-
46
-
47
-
48
-
49
-
50
-
51
-
52
-
53
-
54
-
55
-
56
-
57
-
58
-
59
-
60
-
61
-
62
-
63
-
64
-
65
-
66
-
67
-
68
-
69
-
70
-
71
-
72
-
73
-
74
-
75
-
76
-
77
-
78
-
79
-
80
-
81
-
82
-
83
-
84
-
85
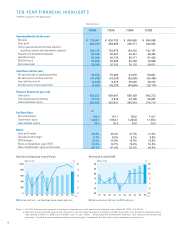
 |
 |

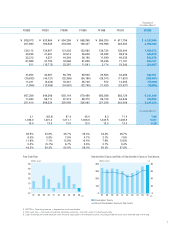
¥ 535,073
207,660
135,112
40,235
32,313
61,989
511
41,854
(30,633)
11,221
(1,996)
567,399
71,260
251,610
2.1
1,036.0
10.0
38.8%
6.0%
11.6%
0.2%
44.3%
¥ 533,964
180,535
134,907
41,407
4,221
37,790
(15,773)
33,687
(40,121)
(6,434)
(12,056)
549,366
58,711
298,234
(63.5)
1,201.2
13.0
33.8%
0.8%
7.1%
(5.1%)
54.3%
¥ 594,259
218,065
131,203
42,513
44,349
76,566
22,297
50,796
(32,365)
18,431
(24,582)
593,144
67,213
325,958
87.4
1,311.1
13.0
36.7%
7.5%
12.9%
6.7%
55.0%
¥ 555,358
196,447
133,662
36,605
26,180
57,625
11,561
59,926
(34,180)
25,746
(23,785)
579,489
69,472
336,062
45.0
1,308.6
13.0
35.4%
4.7%
10.4%
3.5%
58.0%
¥ 555,280
190,966
136,734
42,383
11,849
43,245
2,174
29,583
(29,011)
572
21,629
580,586
86,723
321,258
8.3
1,249.5
13.0
34.4%
2.1%
7.8%
0.7%
55.3%
¥ 611,795
224,350
138,404
39,914
46,032
77,161
18,300
32,086
(17,631)
14,455
(23,637)
593,129
54,544
343,066
71.4
1,308.9
13.0
36.7%
7.5%
12.6%
5.4%
57.8%
$ 6,242,805
2,408,466
1,424,873
440,915
542,678
830,161
324,407
343,551
(398,941)
(55,390)
(39,805)
5,341,840
184,856
3,244,254
1.40
14.07
0.29
FY2002 FY2001 FY2000 FY1999 FY1998 FY1997 FY2006
Thousands of
U.S. dollars (Note 1)
(FY)
97 009998 02 0301 04 05 06
-10
0
10
20
30
40
50
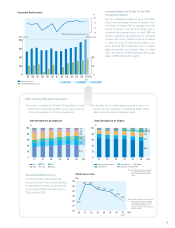
Free Cash Flow
(Billions of yen)
U.S. dollars (Note 1)
3. EBITDA = Operating income + depreciation and amortization.
4. Free cash flow = Net cash provided by operating activities – net cash used in investing activities.
5. Cash dividends per share represent the amounts applicable to the respective year, including dividends to be paid after the end of the year.
(FY)
97 009998 02 0301 04 05 06
(%)
0
100
200
300
400
Shareholders’ Equity and Ratio of Shareholders’ Equity to Total Assets
(Billions of yen)
Shareholders’ Equity
Ratio of Shareholders’ Equity to Total Assets
0
20
40
60
80
7